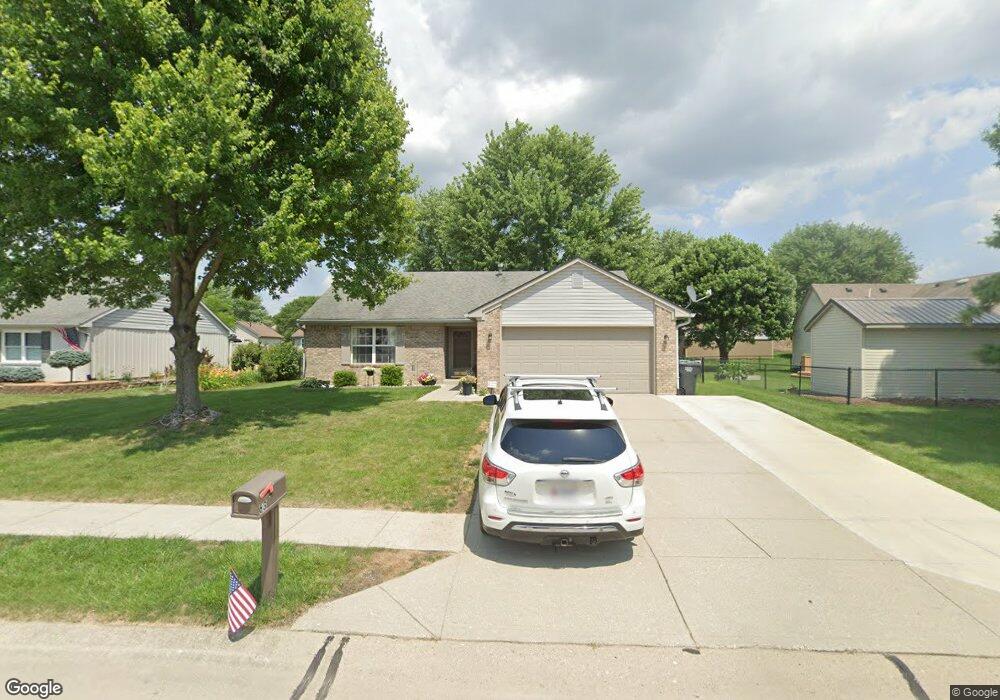
63 Anjuli Ct Whiteland, IN 46184
Estimated Value: $246,000 - $268,000
3
Beds
2
Baths
1,268
Sq Ft
$200/Sq Ft
Est. Value
About This Home
This home is located at 63 Anjuli Ct, Whiteland, IN 46184 and is currently estimated at $253,368, approximately $199 per square foot. 63 Anjuli Ct is a home located in Johnson County with nearby schools including Break-O-Day Elementary School, Clark-Pleasant Middle School, and Whiteland Community High School.
Ownership History
Date
Name
Owned For
Owner Type
Purchase Details
Closed on
Sep 13, 2017
Sold by
Pope Ralph E
Bought by
Rockwell Brent A
Current Estimated Value
Home Financials for this Owner
Home Financials are based on the most recent Mortgage that was taken out on this home.
Original Mortgage
$128,040
Outstanding Balance
$106,894
Interest Rate
3.89%
Mortgage Type
New Conventional
Estimated Equity
$146,474
Purchase Details
Closed on
Sep 29, 2014
Sold by
Pope Cynthia A
Bought by
Pope Ralph E
Create a Home Valuation Report for This Property
The Home Valuation Report is an in-depth analysis detailing your home's value as well as a comparison with similar homes in the area
Home Values in the Area
Average Home Value in this Area
Purchase History
| Date | Buyer | Sale Price | Title Company |
|---|---|---|---|
| Rockwell Brent A | -- | -- | |
| Pope Ralph E | -- | Mainsource Title Llc |
Source: Public Records
Mortgage History
| Date | Status | Borrower | Loan Amount |
|---|---|---|---|
| Open | Rockwell Brent A | $128,040 |
Source: Public Records
Tax History Compared to Growth
Tax History
| Year | Tax Paid | Tax Assessment Tax Assessment Total Assessment is a certain percentage of the fair market value that is determined by local assessors to be the total taxable value of land and additions on the property. | Land | Improvement |
|---|---|---|---|---|
| 2025 | $2,095 | $235,000 | $51,000 | $184,000 |
| 2024 | $2,095 | $205,200 | $51,000 | $154,200 |
| 2023 | $2,071 | $198,700 | $51,000 | $147,700 |
| 2022 | $1,828 | $176,900 | $32,000 | $144,900 |
| 2021 | $1,472 | $142,500 | $32,000 | $110,500 |
| 2020 | $1,378 | $132,900 | $26,400 | $106,500 |
| 2019 | $1,264 | $122,200 | $26,400 | $95,800 |
| 2018 | $1,043 | $111,700 | $16,700 | $95,000 |
| 2017 | $930 | $98,900 | $16,700 | $82,200 |
| 2016 | $1,014 | $101,000 | $16,700 | $84,300 |
| 2014 | $1,024 | $101,400 | $16,700 | $84,700 |
| 2013 | $1,024 | $102,100 | $16,700 | $85,400 |
Source: Public Records
Map
Nearby Homes
- 12 Rypma Row
- 647 Bluestem Cir
- Liberty Plan at Crossroads at Southport
- 7331 Deerberg Dr
- Jefferson Plan at Crossroads at Southport
- 7338 Deerberg Dr
- Rushmore Plan at Crossroads at Southport
- Lincoln Plan at Crossroads at Southport
- Washington Plan at Crossroads at Southport
- 346 Switchgrass Ln
- 821 Princeton Dr
- 731 W 600 N
- 230 Parkview Dr
- 239 Shelton Place
- 143 Tracy Ridge Blvd
- 250 Southlane Dr
- 0 E 700 N Unit MBR22036500
- 135 Bradford Place
- 34 Crestwood Dr
- 106 Tracy Ridge Blvd