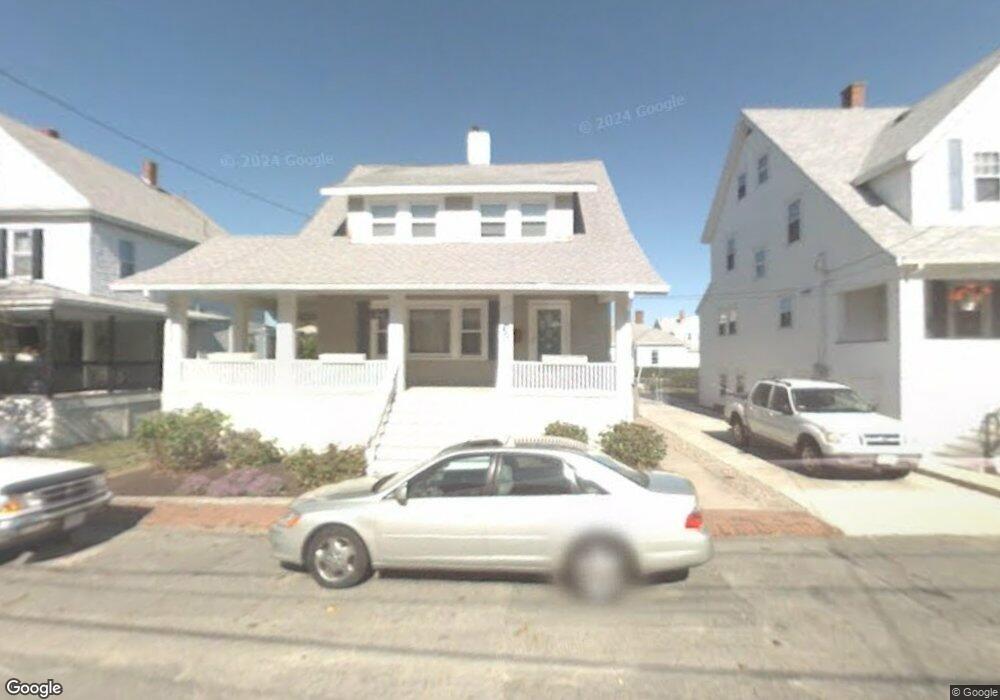
63 B St Unit 1 Hull, MA 02045
The Alphabets NeighborhoodEstimated Value: $736,042 - $962,000
4
Beds
2
Baths
999
Sq Ft
$843/Sq Ft
Est. Value
About This Home
This home is located at 63 B St Unit 1, Hull, MA 02045 and is currently estimated at $842,011, approximately $842 per square foot. 63 B St Unit 1 is a home located in Plymouth County with nearby schools including Lillian M. Jacobs Elementary School, Memorial Middle School, and Hull High School.
Ownership History
Date
Name
Owned For
Owner Type
Purchase Details
Closed on
Mar 26, 2018
Sold by
Greenberg Bruce and Greenberg Michelle
Bought by
Greenberg Ft and Greenberg
Current Estimated Value
Purchase Details
Closed on
Oct 8, 2010
Sold by
Rittenburg Charlotte
Bought by
Greenberg Bruce and Greenburg Michelle
Home Financials for this Owner
Home Financials are based on the most recent Mortgage that was taken out on this home.
Original Mortgage
$332,000
Interest Rate
4.37%
Mortgage Type
Purchase Money Mortgage
Create a Home Valuation Report for This Property
The Home Valuation Report is an in-depth analysis detailing your home's value as well as a comparison with similar homes in the area
Home Values in the Area
Average Home Value in this Area
Purchase History
| Date | Buyer | Sale Price | Title Company |
|---|---|---|---|
| Greenberg Ft | -- | -- | |
| Greenberg Bruce | $415,000 | -- |
Source: Public Records
Mortgage History
| Date | Status | Borrower | Loan Amount |
|---|---|---|---|
| Previous Owner | Greenberg Bruce | $332,000 |
Source: Public Records
Tax History Compared to Growth
Tax History
| Year | Tax Paid | Tax Assessment Tax Assessment Total Assessment is a certain percentage of the fair market value that is determined by local assessors to be the total taxable value of land and additions on the property. | Land | Improvement |
|---|---|---|---|---|
| 2025 | $7,547 | $673,800 | $339,700 | $334,100 |
| 2024 | $7,427 | $637,500 | $313,500 | $324,000 |
| 2023 | $6,915 | $568,200 | $261,300 | $306,900 |
| 2022 | $6,779 | $540,600 | $248,200 | $292,400 |
| 2021 | $6,701 | $528,500 | $248,200 | $280,300 |
| 2020 | $6,498 | $506,900 | $248,200 | $258,700 |
| 2019 | $6,063 | $464,600 | $222,100 | $242,500 |
| 2018 | $5,867 | $437,200 | $222,100 | $215,100 |
| 2017 | $5,777 | $421,100 | $222,100 | $199,000 |
| 2016 | $5,676 | $421,100 | $222,100 | $199,000 |
| 2015 | $5,506 | $395,000 | $196,000 | $199,000 |
| 2014 | $5,479 | $395,000 | $196,000 | $199,000 |
Source: Public Records
Map
Nearby Homes