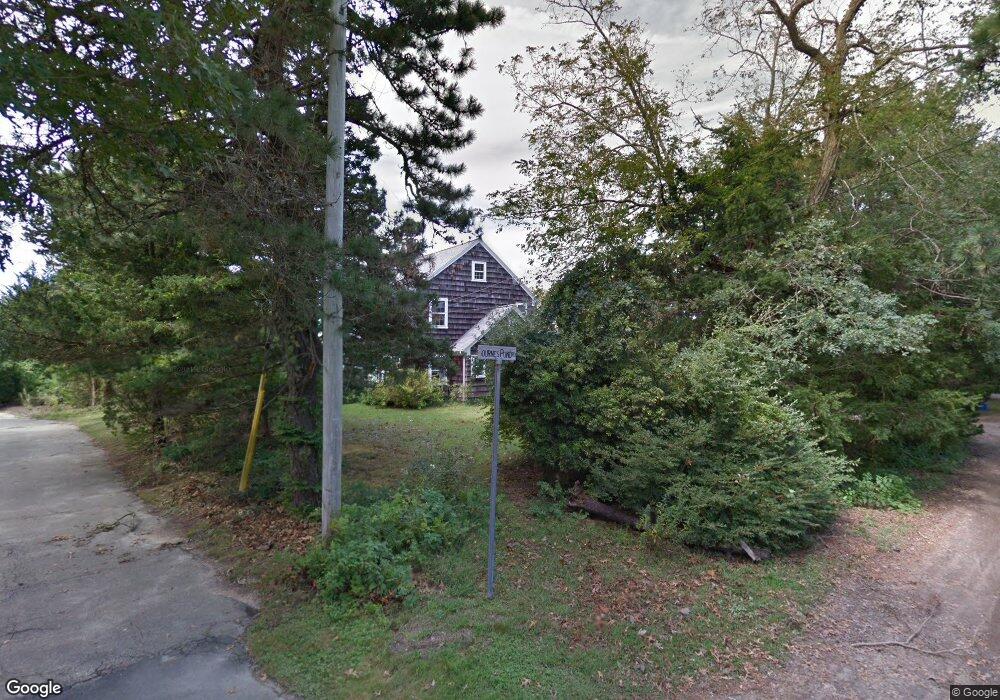
63 Bayberry Rd East Falmouth, MA 02536
East Falmouth NeighborhoodEstimated Value: $1,417,000 - $2,324,000
4
Beds
3
Baths
2,306
Sq Ft
$823/Sq Ft
Est. Value
About This Home
This home is located at 63 Bayberry Rd, East Falmouth, MA 02536 and is currently estimated at $1,896,899, approximately $822 per square foot. 63 Bayberry Rd is a home located in Barnstable County with nearby schools including East Falmouth Elementary School, Morse Pond School, and Lawrence School.
Ownership History
Date
Name
Owned For
Owner Type
Purchase Details
Closed on
Oct 1, 1997
Sold by
Pappas Catherine
Bought by
Yuskaitis Mark E and Yuskaitis Kelly M
Current Estimated Value
Home Financials for this Owner
Home Financials are based on the most recent Mortgage that was taken out on this home.
Original Mortgage
$135,000
Outstanding Balance
$21,613
Interest Rate
7.41%
Mortgage Type
Purchase Money Mortgage
Estimated Equity
$1,875,286
Create a Home Valuation Report for This Property
The Home Valuation Report is an in-depth analysis detailing your home's value as well as a comparison with similar homes in the area
Home Values in the Area
Average Home Value in this Area
Purchase History
| Date | Buyer | Sale Price | Title Company |
|---|---|---|---|
| Yuskaitis Mark E | $145,000 | -- |
Source: Public Records
Mortgage History
| Date | Status | Borrower | Loan Amount |
|---|---|---|---|
| Open | Yuskaitis Mark E | $135,000 |
Source: Public Records
Tax History Compared to Growth
Tax History
| Year | Tax Paid | Tax Assessment Tax Assessment Total Assessment is a certain percentage of the fair market value that is determined by local assessors to be the total taxable value of land and additions on the property. | Land | Improvement |
|---|---|---|---|---|
| 2025 | $10,978 | $1,870,200 | $1,362,200 | $508,000 |
| 2024 | $11,425 | $1,819,300 | $1,362,200 | $457,100 |
| 2023 | $12,410 | $1,793,300 | $1,362,200 | $431,100 |
| 2022 | $12,866 | $1,598,200 | $1,200,100 | $398,100 |
| 2021 | $13,585 | $1,598,200 | $1,200,100 | $398,100 |
| 2020 | $12,092 | $1,407,700 | $1,091,000 | $316,700 |
| 2019 | $11,925 | $1,393,100 | $1,091,000 | $302,100 |
| 2018 | $11,910 | $1,384,900 | $1,091,000 | $293,900 |
| 2017 | $11,581 | $1,357,700 | $1,091,000 | $266,700 |
| 2016 | $11,364 | $1,357,700 | $1,091,000 | $266,700 |
| 2015 | $11,066 | $1,351,100 | $1,091,000 | $260,100 |
| 2014 | $10,852 | $1,331,500 | $1,091,000 | $240,500 |
Source: Public Records
Map
Nearby Homes
- 21 Captain Davis Ln
- 472 & 474 Davisville Rd
- 23 N Bournes Pond Rd
- 23 N Bournes Pond Rd
- 52 Bacon Farm Rd
- 53 Eel River Rd
- 381 Seacoast Shores Blvd
- 0 Tobey Ln
- 285 Edgewater Dr W
- 15 Ovington Dr
- 42 Hanson Cir
- 58 Striper Ln
- 231 Edgewater Dr W
- Lot 2 Pine Grove Ave
- 30 Weatherglass Ln
- 214 Menauhant Rd
- 1 Cuttysark Rd
- 106 Beach St
- 16 Edgewood Dr
- 9 Theroux Dr
- 36 Bayberry Rd
- 77 Bournes Pond Rd
- 49 Bournes Pond Rd
- 25 Bayberry Rd
- 72 Bournes Pond Rd
- 56 Bournes Pond Rd
- 83 Bournes Pond Rd
- 43 Bournes Pond Rd
- 50 Bournes Pond Rd
- 50 Bourne's Pond
- 80 Bournes Pond Rd
- 18 Bayberry Rd
- 89 Bournes Pond Rd
- 15 Bayberry Rd
- 10 Lincoln Ln
- 44 Bournes Pond Rd
- 35 Bournes Pond Rd
- 38 Bournes Pond Rd
- 95 Bournes Pond Rd
- 94 Bournes Pond Rd