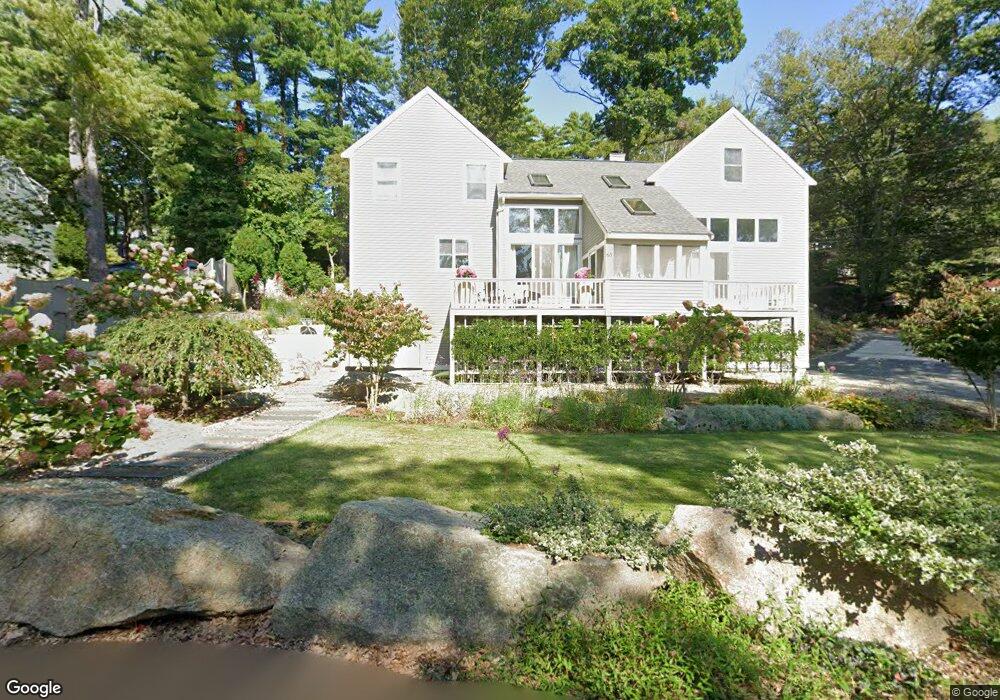
63 Bennett St S Gloucester, MA 01930
Estimated Value: $1,014,350 - $1,434,000
3
Beds
2
Baths
2,280
Sq Ft
$521/Sq Ft
Est. Value
About This Home
This home is located at 63 Bennett St S, Gloucester, MA 01930 and is currently estimated at $1,186,838, approximately $520 per square foot. 63 Bennett St S is a home located in Essex County with nearby schools including Plum Cove School, Ralph B O'maley Middle School, and Gloucester High School.
Ownership History
Date
Name
Owned For
Owner Type
Purchase Details
Closed on
Aug 28, 1996
Sold by
Titus Patrick J
Bought by
Kennedy Thomas J and Kennedy Jennifer
Current Estimated Value
Home Financials for this Owner
Home Financials are based on the most recent Mortgage that was taken out on this home.
Original Mortgage
$120,000
Interest Rate
8.18%
Mortgage Type
Purchase Money Mortgage
Create a Home Valuation Report for This Property
The Home Valuation Report is an in-depth analysis detailing your home's value as well as a comparison with similar homes in the area
Purchase History
| Date | Buyer | Sale Price | Title Company |
|---|---|---|---|
| Kennedy Thomas J | $54,900 | -- |
Source: Public Records
Mortgage History
| Date | Status | Borrower | Loan Amount |
|---|---|---|---|
| Open | Kennedy Thomas J | $117,000 | |
| Closed | Kennedy Thomas J | $120,000 |
Source: Public Records
Tax History
| Year | Tax Paid | Tax Assessment Tax Assessment Total Assessment is a certain percentage of the fair market value that is determined by local assessors to be the total taxable value of land and additions on the property. | Land | Improvement |
|---|---|---|---|---|
| 2025 | $9,164 | $942,800 | $196,000 | $746,800 |
| 2024 | $8,434 | $866,800 | $186,600 | $680,200 |
| 2023 | $7,785 | $735,100 | $166,700 | $568,400 |
| 2022 | $7,503 | $639,600 | $145,000 | $494,600 |
| 2021 | $7,231 | $581,300 | $131,800 | $449,500 |
| 2020 | $7,372 | $597,900 | $131,800 | $466,100 |
| 2019 | $7,728 | $609,000 | $131,800 | $477,200 |
| 2018 | $7,149 | $552,900 | $131,800 | $421,100 |
| 2017 | $7,210 | $546,600 | $125,500 | $421,100 |
| 2016 | $7,034 | $516,800 | $130,900 | $385,900 |
| 2015 | $6,805 | $498,500 | $130,900 | $367,600 |
Source: Public Records
Map
Nearby Homes
- 672 Washington St
- 136 Leonard St
- 2 Breezy Point Rd
- 4 Ciaramitaro Ct
- 3 Deacon Farm Ln
- 226 Atlantic St
- 31 Echo Ave
- 13 Honeysuckle Rd
- 178 Atlantic St
- 167 Atlantic St
- 9 Hickory St
- 1030 Washington St
- 43 High St Unit B
- 13 Mystic Ave
- 8 Mystic Ave
- 177 Main St
- 3 Rockland St
- 33 Quarry Ridge Ln Unit 33
- 98 Maplewood Ave
- 6 Monroe Ct
- 59 Bennett St S
- 64 Dennison St
- 65 Dennison St
- 55 Dennison St
- 55 Dennison St
- 55 Dennison St Unit Winter
- 62 Bennett St S
- 82 Dennison St
- 53 Dennison St
- 75 Dennison St
- 60 Dennison St
- 55 Bennett St S
- 60 Bennett St S
- 79 Dennison St
- 53 Bennett St S
- 81 Dennison St
- 45 Dennison St
- 92 Holly St
- 98 Holly St
- 86 Dennison St
Your Personal Tour Guide
Ask me questions while you tour the home.