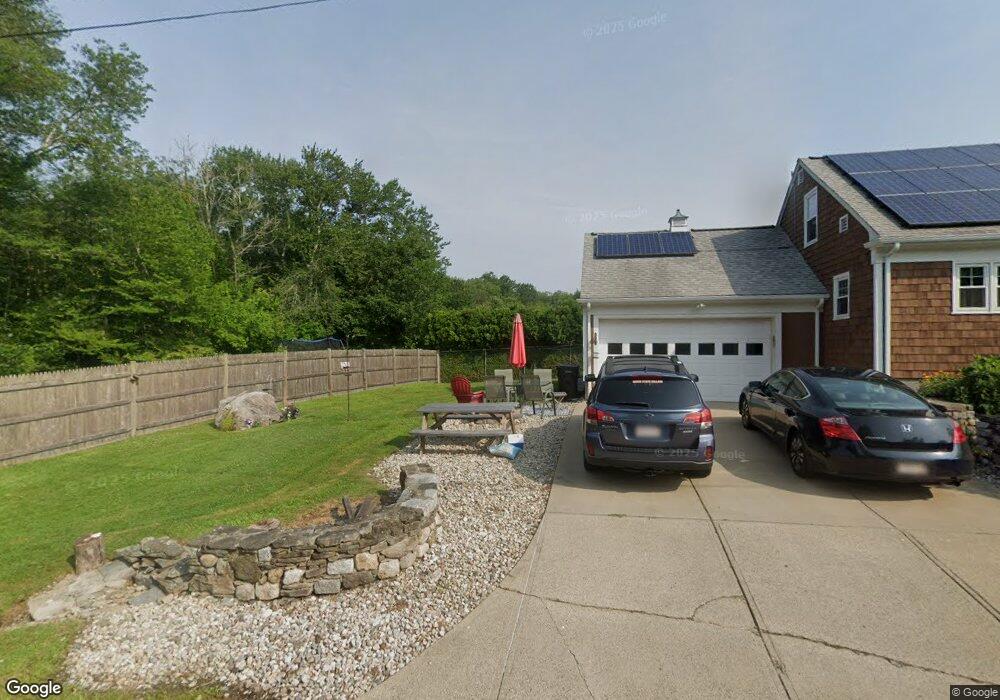
63 Berkley St North Dartmouth, MA 02747
Buttonwood Park NeighborhoodEstimated Value: $501,000 - $521,000
3
Beds
2
Baths
1,770
Sq Ft
$289/Sq Ft
Est. Value
About This Home
This home is located at 63 Berkley St, North Dartmouth, MA 02747 and is currently estimated at $511,166, approximately $288 per square foot. 63 Berkley St is a home located in Bristol County with nearby schools including Dartmouth High School, Our Sister's School, and Bishop Stang High School.
Ownership History
Date
Name
Owned For
Owner Type
Purchase Details
Closed on
Nov 20, 2023
Sold by
Rosen Elizabeth M
Bought by
Rosen Hannah and Rosen Eleanor
Current Estimated Value
Purchase Details
Closed on
Apr 9, 2008
Sold by
Barbara A Cholette Ret and Cholette
Bought by
Rosen Elizabeth M
Home Financials for this Owner
Home Financials are based on the most recent Mortgage that was taken out on this home.
Original Mortgage
$60,000
Interest Rate
6.3%
Mortgage Type
Purchase Money Mortgage
Create a Home Valuation Report for This Property
The Home Valuation Report is an in-depth analysis detailing your home's value as well as a comparison with similar homes in the area
Home Values in the Area
Average Home Value in this Area
Purchase History
| Date | Buyer | Sale Price | Title Company |
|---|---|---|---|
| Rosen Hannah | -- | None Available | |
| Rosen Elizabeth M | $274,000 | -- |
Source: Public Records
Mortgage History
| Date | Status | Borrower | Loan Amount |
|---|---|---|---|
| Previous Owner | Rosen Elizabeth M | $60,000 |
Source: Public Records
Tax History Compared to Growth
Tax History
| Year | Tax Paid | Tax Assessment Tax Assessment Total Assessment is a certain percentage of the fair market value that is determined by local assessors to be the total taxable value of land and additions on the property. | Land | Improvement |
|---|---|---|---|---|
| 2025 | $3,357 | $370,900 | $156,500 | $214,400 |
| 2024 | $3,267 | $357,400 | $149,300 | $208,100 |
| 2023 | $3,198 | $330,000 | $138,400 | $191,600 |
| 2022 | $3,081 | $297,400 | $132,400 | $165,000 |
| 2021 | $3,037 | $280,400 | $116,900 | $163,500 |
| 2020 | $2,905 | $267,000 | $116,900 | $150,100 |
| 2019 | $2,876 | $265,100 | $116,900 | $148,200 |
| 2018 | $2,609 | $244,300 | $116,900 | $127,400 |
| 2017 | $2,476 | $232,700 | $110,200 | $122,500 |
| 2016 | $2,449 | $231,500 | $110,200 | $121,300 |
| 2015 | $2,373 | $225,800 | $103,000 | $122,800 |
| 2014 | $2,231 | $213,700 | $93,400 | $120,300 |
Source: Public Records
Map
Nearby Homes
- 59 Longwood Ave
- 295 Commonwealth Ave
- 317 Commonwealth Ave
- 50 Gaywood St
- 0 Norfolk Ave Unit 73403282
- 0 Middlesex St
- 35 Jenny Lind St
- 35 Suffolk Ave
- 469 Hillman St
- 124 Francis St
- ) Hapwell & Summit St
- 0 Victoria St Unit 73457953
- 245 Brownell St
- 729 Allen St
- 605 Union St
- 511 Bedford St
- 122 Armour St
- 354-358 Arnold St
- 40 Golf St
- 260 Maple St