Estimated Value: $366,000 - $398,876
4
Beds
3
Baths
2,700
Sq Ft
$142/Sq Ft
Est. Value
About This Home
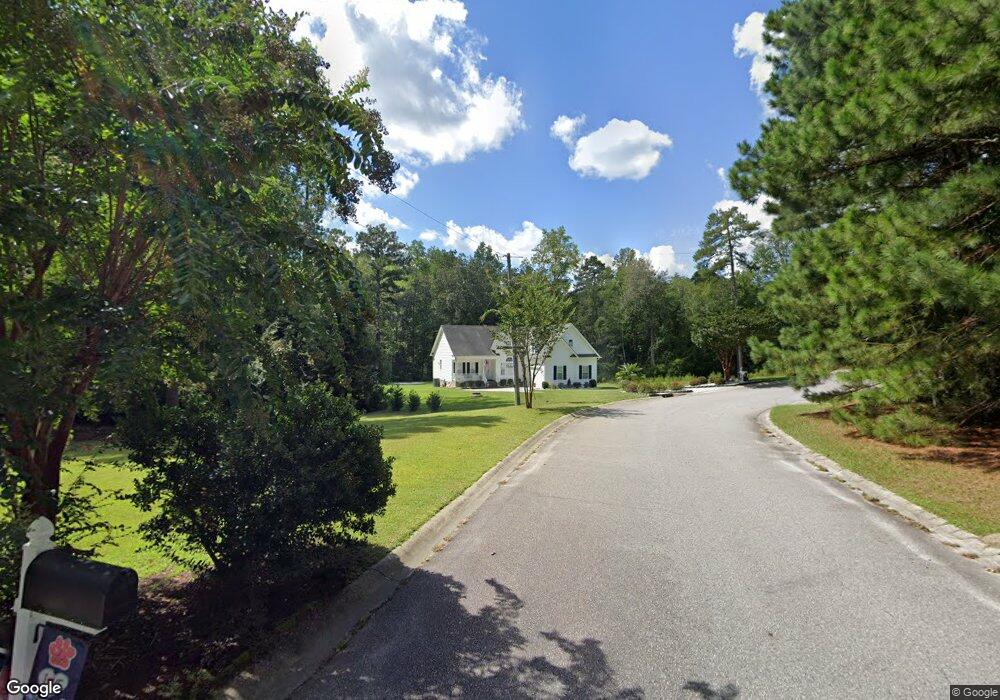
This home is located at 63 Bird Song Ln, Elgin, SC 29045 and is currently estimated at $383,469, approximately $142 per square foot. 63 Bird Song Ln is a home located in Kershaw County with nearby schools including Doby's Mill Elementary School, Leslie M. Stover Middle School, and Lugoff-Elgin High School.
Ownership History
Date
Name
Owned For
Owner Type
Purchase Details
Closed on
Jan 19, 2022
Sold by
Baber Robert E
Bought by
Simpson Jaime Luis and Simpson Tanya Lynne
Current Estimated Value
Home Financials for this Owner
Home Financials are based on the most recent Mortgage that was taken out on this home.
Original Mortgage
$264,000
Outstanding Balance
$174,467
Interest Rate
3.11%
Mortgage Type
New Conventional
Estimated Equity
$209,002
Purchase Details
Closed on
Jan 29, 2020
Sold by
Baber Robert E
Bought by
Baber Robert E and Mccloud Juan Gordon
Purchase Details
Closed on
Jun 20, 2018
Sold by
Wisecarver David S
Bought by
Baber Robert E
Purchase Details
Closed on
Aug 22, 2008
Sold by
Bartlett & Davis Construction
Bought by
Wisecarver David S
Purchase Details
Closed on
Apr 25, 2008
Sold by
Country Properties
Bought by
Bartlett & Davis Construction
Create a Home Valuation Report for This Property
The Home Valuation Report is an in-depth analysis detailing your home's value as well as a comparison with similar homes in the area
Purchase History
We collect this data history from publicly available records. To have your information removed, we recommend requesting removal directly through your county’s website.
| Date | Buyer | Sale Price | Title Company |
|---|---|---|---|
| Simpson Jaime Luis | $335,000 | Jared Smith Llc | |
| Baber Robert E | -- | Connell Law Firm Llc | |
| Baber Robert E | -- | -- | |
| Baber Robert E | $246,000 | Ashley & Gibbons Pa | |
| Wisecarver David S | $224,900 | -- | |
| Bartlett & Davis Construction | $30,000 | -- |
Source: Public Records
Mortgage History
We collect this data history from publicly available records. To have your information removed, we recommend requesting removal directly through your county’s website.
| Date | Status | Borrower | Loan Amount |
|---|---|---|---|
| Open | Simpson Jaime Luis | $264,000 |
Source: Public Records
Tax History
| Year | Tax Paid | Tax Assessment Tax Assessment Total Assessment is a certain percentage of the fair market value that is determined by local assessors to be the total taxable value of land and additions on the property. | Land | Improvement |
|---|---|---|---|---|
| 2025 | $1,724 | $335,000 | $40,000 | $295,000 |
| 2024 | $1,724 | $335,000 | $40,000 | $295,000 |
| 2023 | $2,004 | $335,000 | $40,000 | $295,000 |
| 2022 | $0 | $335,000 | $40,000 | $295,000 |
| 2021 | $0 | $256,100 | $40,000 | $216,100 |
| 2020 | $0 | $256,000 | $40,000 | $216,000 |
| 2019 | $0 | $256,000 | $40,000 | $216,000 |
| 2018 | $1,322 | $246,000 | $30,000 | $216,000 |
| 2017 | $1,218 | $233,400 | $30,000 | $203,400 |
| 2016 | $1,299 | $242,800 | $30,000 | $212,800 |
| 2015 | $1,116 | $242,800 | $30,000 | $212,800 |
| 2014 | $1,116 | $9,712 | $0 | $0 |
Source: Public Records
Map
Nearby Homes
- 12 Manzanita Ct
- 759 Kirkland Cir
- 51 Sumner St
- 802 White Pond Rd
- 1432 Haigs Creek Dr
- 1600 Highway Church Rd
- 972 Gary Goff Rd
- 238 Haigs Creek N
- 2070 Highway Church Rd
- 2668 Steven Campbell Rd
- 611 Finch Ct
- 605 Finch Ct
- 1017 Oakland Dr
- 1005 Dogwood Ave
- 2349 Green Hill Rd
- 2023 Shirley Rd
- 7 Templand Ct
- 6017 Edgemont Ct
- 6027 Edgemont Ct
- 6015 Edgemont Ct
- 67 Bird Song Ln
- 59 Bird Song Ln
- 222 Sorrel Tree Ln
- 234 Sorrel Tree Ln
- 218 Sorrel Tree Ln
- 230 Sorrel Tree Ln
- 226 Sorrel Tree Ln
- 73 Bird Song Ln
- 238 Sorrel Tree Ln
- 214 Sorrel Tree Ln
- 225 Sorrel Tree Ln
- 212 Sorrel Tree Ln
- 242 Sorrel Tree Ln
- 211 Sorrel Tree Ln
- 79 Bird Song Ln
- 44 Bird Song Ln
- 31 Calabash Ln
- 246 Sorrel Tree Ln
- 210 Sorrel Tree Ln
- 40 Bird Song Ln
Your Personal Tour Guide
Ask me questions while you tour the home.