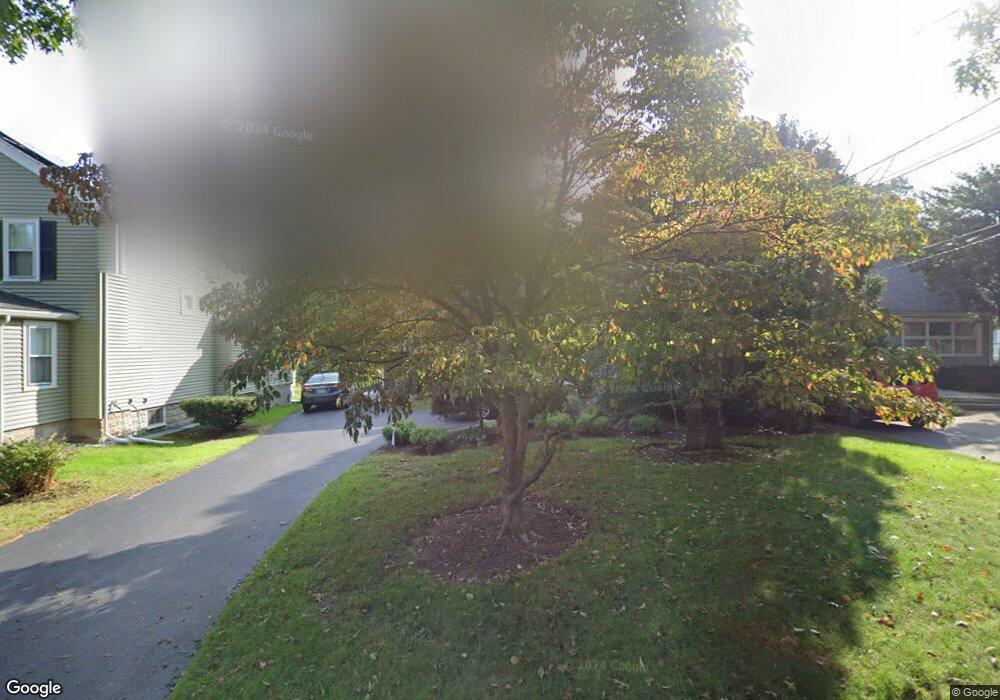
63 Bridge St Lexington, MA 02421
Idylwilde NeighborhoodEstimated Value: $1,536,000 - $1,854,000
3
Beds
4
Baths
2,382
Sq Ft
$735/Sq Ft
Est. Value
About This Home
This home is located at 63 Bridge St, Lexington, MA 02421 and is currently estimated at $1,750,065, approximately $734 per square foot. 63 Bridge St is a home located in Middlesex County with nearby schools including Bridge Elementary School, Jonas Clarke Middle School, and Lexington High School.
Ownership History
Date
Name
Owned For
Owner Type
Purchase Details
Closed on
Apr 27, 2006
Sold by
Dulberg Debi and Serotkin Paul
Bought by
Dulbert Debi and Serotkin Paul
Current Estimated Value
Purchase Details
Closed on
Nov 7, 1997
Sold by
Yu I-Hsiang and Yu Shu-Min
Bought by
Serotkin Paul and Dulberg Debi
Purchase Details
Closed on
Apr 30, 1993
Sold by
Cerullo Phyllis J and Cerullo David G
Bought by
Yu I-Hsiang and Yu Shu-Min
Create a Home Valuation Report for This Property
The Home Valuation Report is an in-depth analysis detailing your home's value as well as a comparison with similar homes in the area
Home Values in the Area
Average Home Value in this Area
Purchase History
| Date | Buyer | Sale Price | Title Company |
|---|---|---|---|
| Dulbert Debi | -- | -- | |
| Serotkin Paul | $442,000 | -- | |
| Yu I-Hsiang | $365,000 | -- | |
| Yu I-Hsiang | $365,000 | -- |
Source: Public Records
Mortgage History
| Date | Status | Borrower | Loan Amount |
|---|---|---|---|
| Previous Owner | Yu I-Hsiang | $342,000 | |
| Previous Owner | Yu I-Hsiang | $344,000 |
Source: Public Records
Tax History
| Year | Tax Paid | Tax Assessment Tax Assessment Total Assessment is a certain percentage of the fair market value that is determined by local assessors to be the total taxable value of land and additions on the property. | Land | Improvement |
|---|---|---|---|---|
| 2025 | $16,107 | $1,317,000 | $702,000 | $615,000 |
| 2024 | $15,705 | $1,282,000 | $668,000 | $614,000 |
| 2023 | $15,405 | $1,185,000 | $608,000 | $577,000 |
| 2022 | $14,766 | $1,070,000 | $552,000 | $518,000 |
| 2021 | $7,151 | $990,000 | $526,000 | $464,000 |
| 2020 | $6,934 | $980,000 | $526,000 | $454,000 |
| 2019 | $13,216 | $936,000 | $501,000 | $435,000 |
| 2018 | $6,151 | $904,000 | $477,000 | $427,000 |
| 2017 | $10,998 | $759,000 | $440,000 | $319,000 |
| 2016 | $10,775 | $738,000 | $419,000 | $319,000 |
| 2015 | $10,744 | $723,000 | $381,000 | $342,000 |
| 2014 | $10,966 | $707,000 | $339,000 | $368,000 |
Source: Public Records
Map
Nearby Homes
Your Personal Tour Guide
Ask me questions while you tour the home.