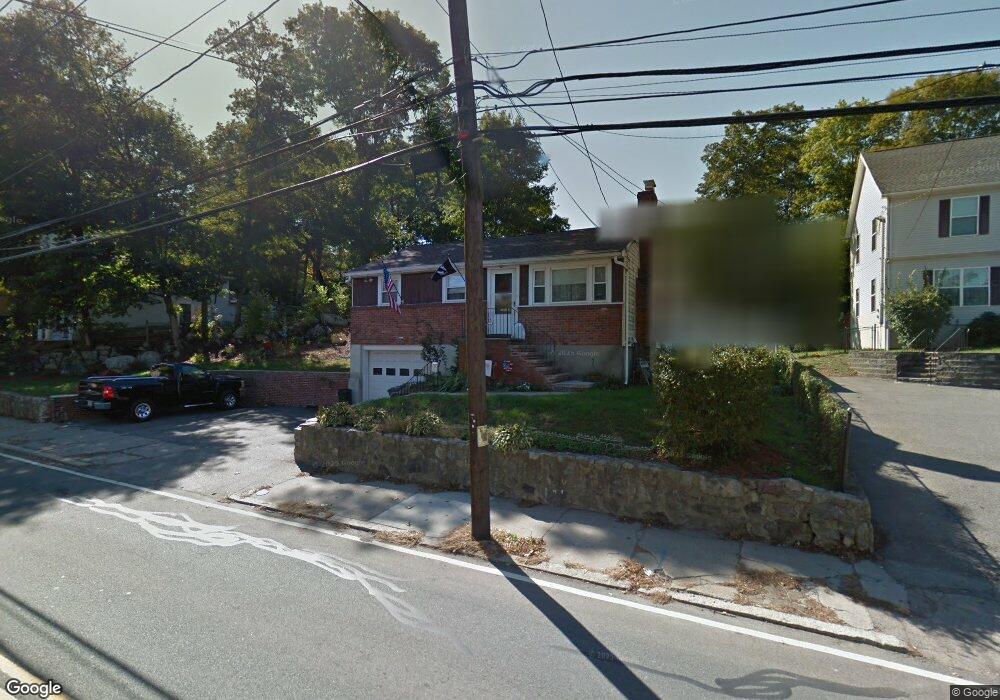
63 Bussey St Dedham, MA 02026
East Dedham NeighborhoodEstimated Value: $556,000 - $630,402
3
Beds
2
Baths
884
Sq Ft
$663/Sq Ft
Est. Value
About This Home
This home is located at 63 Bussey St, Dedham, MA 02026 and is currently estimated at $586,101, approximately $663 per square foot. 63 Bussey St is a home located in Norfolk County with nearby schools including Avery, Dedham Middle School, and Dedham High School.
Ownership History
Date
Name
Owned For
Owner Type
Purchase Details
Closed on
Nov 29, 2002
Sold by
Clement William F and Clement Warren T
Bought by
Mcnamara Bonnie
Current Estimated Value
Home Financials for this Owner
Home Financials are based on the most recent Mortgage that was taken out on this home.
Original Mortgage
$192,000
Outstanding Balance
$81,998
Interest Rate
6.16%
Mortgage Type
Purchase Money Mortgage
Estimated Equity
$504,103
Create a Home Valuation Report for This Property
The Home Valuation Report is an in-depth analysis detailing your home's value as well as a comparison with similar homes in the area
Home Values in the Area
Average Home Value in this Area
Purchase History
| Date | Buyer | Sale Price | Title Company |
|---|---|---|---|
| Mcnamara Bonnie | $240,000 | -- |
Source: Public Records
Mortgage History
| Date | Status | Borrower | Loan Amount |
|---|---|---|---|
| Open | Mcnamara Bonnie | $192,000 |
Source: Public Records
Tax History Compared to Growth
Tax History
| Year | Tax Paid | Tax Assessment Tax Assessment Total Assessment is a certain percentage of the fair market value that is determined by local assessors to be the total taxable value of land and additions on the property. | Land | Improvement |
|---|---|---|---|---|
| 2025 | $6,152 | $487,500 | $268,000 | $219,500 |
| 2024 | $5,994 | $479,500 | $253,800 | $225,700 |
| 2023 | $5,592 | $435,500 | $225,300 | $210,200 |
| 2022 | $5,399 | $404,400 | $220,600 | $183,800 |
| 2021 | $5,286 | $386,700 | $215,900 | $170,800 |
| 2020 | $5,087 | $370,800 | $206,200 | $164,600 |
| 2019 | $4,862 | $343,600 | $179,400 | $164,200 |
| 2018 | $4,537 | $311,800 | $159,400 | $152,400 |
| 2017 | $4,459 | $302,100 | $149,400 | $152,700 |
| 2016 | $4,419 | $285,300 | $130,400 | $154,900 |
| 2015 | $4,171 | $262,800 | $126,200 | $136,600 |
| 2014 | $3,962 | $246,400 | $123,400 | $123,000 |
Source: Public Records
Map
Nearby Homes
- 109 Rockland St
- 16 Mount Hope St
- 83 Mount Hope St
- 94 Rockland St
- 57 Rockland St
- 130 Oak St
- 25R Rockland St Unit 6
- 111 Schiller Rd
- 69 Berlin St
- 1 Columbia Terrace
- 19 Lewis Ln
- 235 Curve St
- 34 Hyde Park St
- 7 Starling St
- 5245 Washington St Unit 5
- 108 High St
- 107 Stimson St
- 216 Grove St
- 231-245 Grove St
- 38 Fleming St