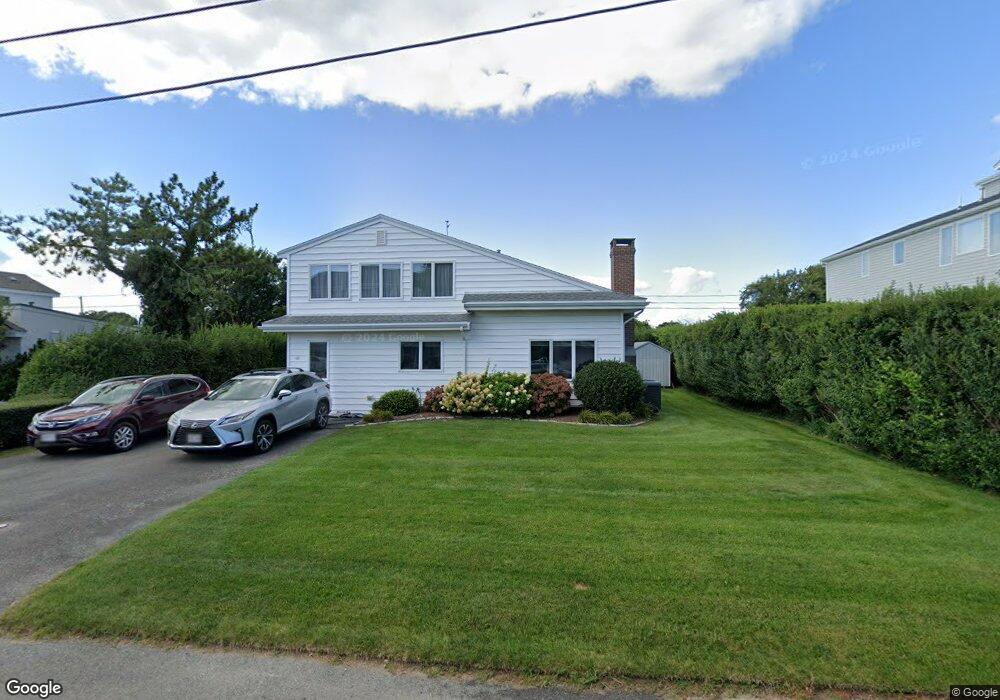
63 Bywater Ct Falmouth, MA 02540
Falmouth Village NeighborhoodEstimated Value: $1,419,472 - $1,707,000
4
Beds
3
Baths
1,501
Sq Ft
$1,052/Sq Ft
Est. Value
About This Home
This home is located at 63 Bywater Ct, Falmouth, MA 02540 and is currently estimated at $1,579,118, approximately $1,052 per square foot. 63 Bywater Ct is a home located in Barnstable County with nearby schools including Mullen-Hall School, Lawrence School, and Morse Pond School.
Ownership History
Date
Name
Owned For
Owner Type
Purchase Details
Closed on
Jan 15, 2014
Sold by
Noone Judith
Bought by
Judith Noone Ret and Noone
Current Estimated Value
Purchase Details
Closed on
May 1, 1998
Sold by
Malkiel Saul
Bought by
Noone James J and Noone Judith
Create a Home Valuation Report for This Property
The Home Valuation Report is an in-depth analysis detailing your home's value as well as a comparison with similar homes in the area
Home Values in the Area
Average Home Value in this Area
Purchase History
| Date | Buyer | Sale Price | Title Company |
|---|---|---|---|
| Judith Noone Ret | -- | -- | |
| Judith Noone Ret | -- | -- | |
| Judith Noone Ret | -- | -- | |
| Noone James J | $265,000 | -- | |
| Noone James J | $265,000 | -- |
Source: Public Records
Mortgage History
| Date | Status | Borrower | Loan Amount |
|---|---|---|---|
| Previous Owner | Noone James J | $65,000 |
Source: Public Records
Tax History Compared to Growth
Tax History
| Year | Tax Paid | Tax Assessment Tax Assessment Total Assessment is a certain percentage of the fair market value that is determined by local assessors to be the total taxable value of land and additions on the property. | Land | Improvement |
|---|---|---|---|---|
| 2025 | $6,669 | $1,136,200 | $692,700 | $443,500 |
| 2024 | $6,506 | $1,036,000 | $629,800 | $406,200 |
| 2023 | $6,802 | $982,900 | $629,800 | $353,100 |
| 2022 | $5,622 | $698,400 | $420,400 | $278,000 |
| 2021 | $5,511 | $648,400 | $402,100 | $246,300 |
| 2020 | $5,255 | $611,800 | $365,500 | $246,300 |
| 2019 | $5,189 | $606,200 | $365,500 | $240,700 |
| 2018 | $5,086 | $586,100 | $365,500 | $220,600 |
| 2017 | $4,938 | $578,900 | $365,500 | $213,400 |
| 2016 | $4,737 | $565,900 | $365,500 | $200,400 |
| 2015 | $4,635 | $565,900 | $365,500 | $200,400 |
| 2014 | $4,602 | $564,700 | $365,500 | $199,200 |
Source: Public Records
Map
Nearby Homes
- 15 Hedge Ln
- 65 Walker St
- 71 Main St
- 98 Main St
- 98 Main St Unit 1
- 253 Scranton Ave
- 30 Katherine Lee Bates Rd
- 480 Main St Unit 1
- 9 Fairmount Ave Unit 1
- 9 Fairmount Ave
- 38 Landfall Unit 38
- 38 Landfall
- 33 Oakwood Ave
- 110 Dillingham Ave Unit 322
- 87 Oyster Pond Rd
- 286 Grand Ave Unit 6
- 286 Grand Ave Unit 8
- 286 Grand Ave Unit 4
- 55 Jericho Path
- 22 Alma Rd