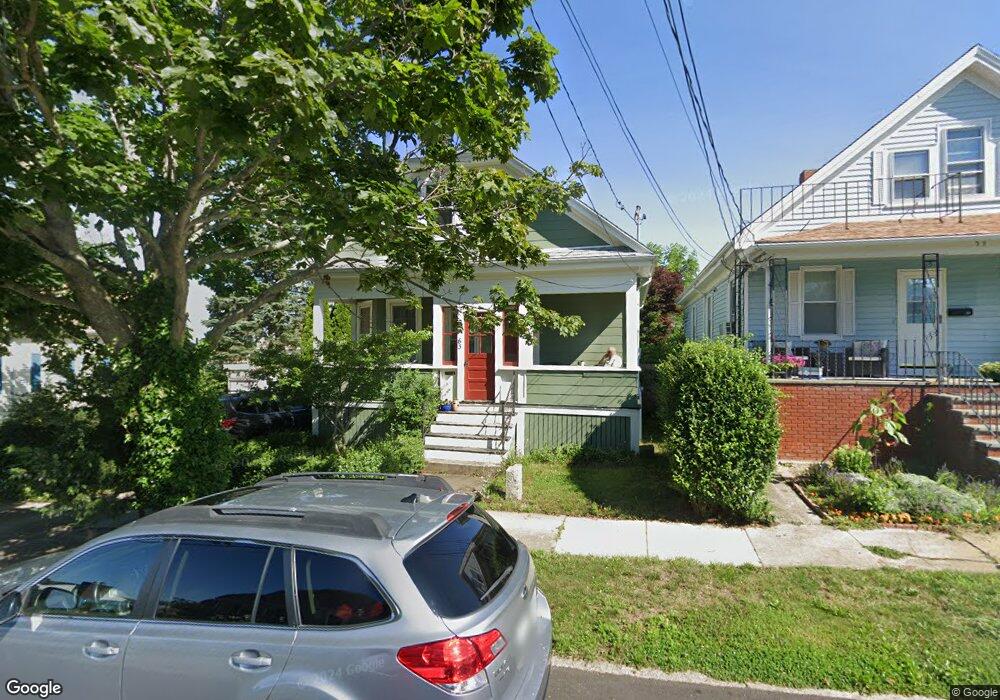
63 Calumet St New Bedford, MA 02744
The South End NeighborhoodEstimated Value: $344,000 - $420,000
3
Beds
1
Bath
989
Sq Ft
$389/Sq Ft
Est. Value
About This Home
This home is located at 63 Calumet St, New Bedford, MA 02744 and is currently estimated at $384,558, approximately $388 per square foot. 63 Calumet St is a home located in Bristol County with nearby schools including William H. Taylor Elementary School, Roosevelt Middle School, and New Bedford High School.
Ownership History
Date
Name
Owned For
Owner Type
Purchase Details
Closed on
Oct 26, 2021
Sold by
Perks Stephanie R and Perks Chancery G
Bought by
Perks Chancery G
Current Estimated Value
Home Financials for this Owner
Home Financials are based on the most recent Mortgage that was taken out on this home.
Original Mortgage
$208,000
Outstanding Balance
$189,677
Interest Rate
2.8%
Mortgage Type
New Conventional
Estimated Equity
$194,881
Purchase Details
Closed on
Apr 13, 2018
Sold by
Perks Phyllis L and Sawyer Laurel A
Bought by
Perks Stephanie R and Perks Chancery G
Home Financials for this Owner
Home Financials are based on the most recent Mortgage that was taken out on this home.
Original Mortgage
$128,000
Interest Rate
4.43%
Mortgage Type
New Conventional
Purchase Details
Closed on
Jun 2, 2009
Sold by
Perks Phyllis L
Bought by
Sawyer Laurel A and Perks Phyllis L
Create a Home Valuation Report for This Property
The Home Valuation Report is an in-depth analysis detailing your home's value as well as a comparison with similar homes in the area
Home Values in the Area
Average Home Value in this Area
Purchase History
| Date | Buyer | Sale Price | Title Company |
|---|---|---|---|
| Perks Chancery G | -- | None Available | |
| Perks Chancery G | -- | None Available | |
| Perks Chancery G | -- | None Available | |
| Perks Stephanie R | $145,000 | -- | |
| Perks Stephanie R | $145,000 | -- | |
| Sawyer Laurel A | -- | -- | |
| Perks Stephanie R | $145,000 | -- | |
| Sawyer Laurel A | -- | -- |
Source: Public Records
Mortgage History
| Date | Status | Borrower | Loan Amount |
|---|---|---|---|
| Open | Perks Chancery G | $208,000 | |
| Closed | Perks Chancery G | $208,000 | |
| Previous Owner | Perks Stephanie R | $128,000 | |
| Previous Owner | Sawyer Laurel A | $95,000 |
Source: Public Records
Tax History Compared to Growth
Tax History
| Year | Tax Paid | Tax Assessment Tax Assessment Total Assessment is a certain percentage of the fair market value that is determined by local assessors to be the total taxable value of land and additions on the property. | Land | Improvement |
|---|---|---|---|---|
| 2025 | $3,640 | $321,800 | $114,100 | $207,700 |
| 2024 | $3,461 | $288,400 | $107,500 | $180,900 |
| 2023 | $3,411 | $238,700 | $92,600 | $146,100 |
| 2022 | $3,102 | $199,600 | $84,300 | $115,300 |
| 2021 | $3,021 | $193,800 | $84,300 | $109,500 |
| 2020 | $3,069 | $189,900 | $84,300 | $105,600 |
| 2019 | $2,940 | $178,500 | $84,300 | $94,200 |
| 2018 | $2,850 | $171,400 | $84,300 | $87,100 |
| 2017 | $2,722 | $163,100 | $84,300 | $78,800 |
| 2016 | $2,577 | $156,300 | $81,000 | $75,300 |
| 2015 | $2,317 | $147,300 | $76,100 | $71,200 |
| 2014 | $2,112 | $139,300 | $76,100 | $63,200 |
Source: Public Records
Map
Nearby Homes