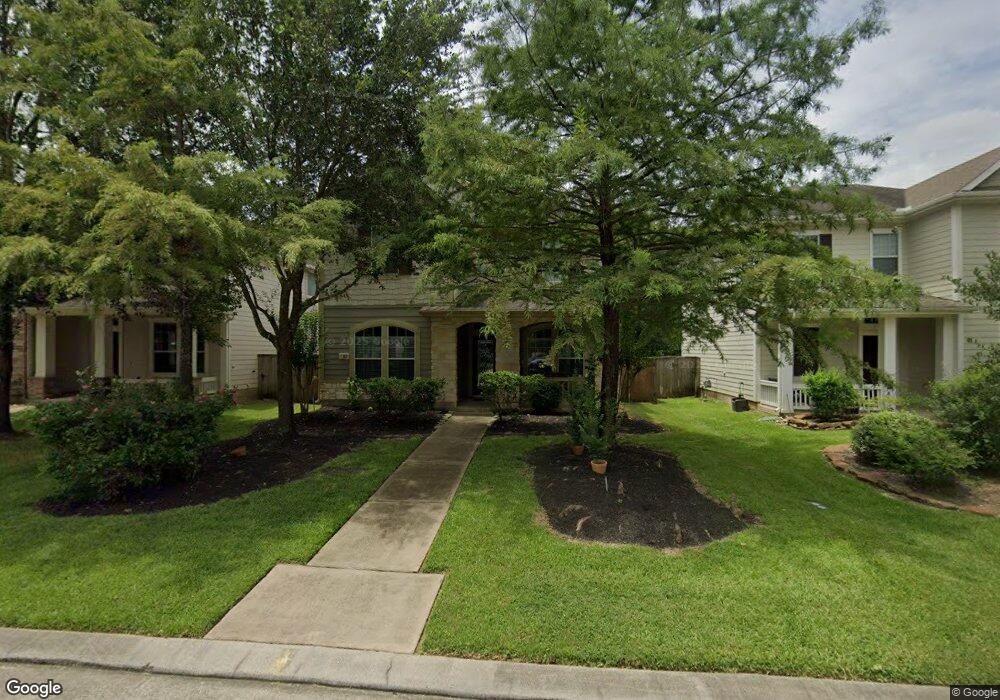
63 Chipwyck Way Spring, TX 77382
Sterling Ridge NeighborhoodEstimated Value: $429,000 - $451,546
3
Beds
3
Baths
2,310
Sq Ft
$190/Sq Ft
Est. Value
About This Home
This home is located at 63 Chipwyck Way, Spring, TX 77382 and is currently estimated at $439,637, approximately $190 per square foot. 63 Chipwyck Way is a home located in Montgomery County with nearby schools including Deretchin Elementary School, McCullough Junior High School, and The Woodlands High School.
Ownership History
Date
Name
Owned For
Owner Type
Purchase Details
Closed on
Mar 25, 2014
Sold by
Hebert Kory and Hebert Mary Catherine
Bought by
Ramirez Reed
Current Estimated Value
Home Financials for this Owner
Home Financials are based on the most recent Mortgage that was taken out on this home.
Original Mortgage
$238,500
Outstanding Balance
$180,293
Interest Rate
4.27%
Mortgage Type
New Conventional
Estimated Equity
$259,344
Purchase Details
Closed on
Apr 2, 2010
Sold by
Kirk Kevin B
Bought by
Hebert Kory and Hebert Mary Catherine
Home Financials for this Owner
Home Financials are based on the most recent Mortgage that was taken out on this home.
Original Mortgage
$222,879
Interest Rate
5%
Mortgage Type
FHA
Purchase Details
Closed on
Nov 9, 2007
Sold by
Weekley Homes Lp
Bought by
Kirk Kevin B
Home Financials for this Owner
Home Financials are based on the most recent Mortgage that was taken out on this home.
Original Mortgage
$135,000
Interest Rate
6.38%
Mortgage Type
Purchase Money Mortgage
Create a Home Valuation Report for This Property
The Home Valuation Report is an in-depth analysis detailing your home's value as well as a comparison with similar homes in the area
Home Values in the Area
Average Home Value in this Area
Purchase History
| Date | Buyer | Sale Price | Title Company |
|---|---|---|---|
| Ramirez Reed | -- | None Available | |
| Hebert Kory | -- | Access Title | |
| Kirk Kevin B | -- | Priority Title Co |
Source: Public Records
Mortgage History
| Date | Status | Borrower | Loan Amount |
|---|---|---|---|
| Open | Ramirez Reed | $238,500 | |
| Previous Owner | Hebert Kory | $222,879 | |
| Previous Owner | Kirk Kevin B | $135,000 |
Source: Public Records
Tax History Compared to Growth
Tax History
| Year | Tax Paid | Tax Assessment Tax Assessment Total Assessment is a certain percentage of the fair market value that is determined by local assessors to be the total taxable value of land and additions on the property. | Land | Improvement |
|---|---|---|---|---|
| 2025 | $6,150 | $404,922 | $60,000 | $344,922 |
| 2024 | $5,529 | $416,911 | -- | -- |
| 2023 | $5,529 | $379,010 | $60,000 | $365,430 |
| 2022 | $6,963 | $344,550 | $60,000 | $315,020 |
| 2021 | $6,834 | $313,230 | $50,870 | $262,360 |
| 2020 | $6,574 | $288,580 | $50,870 | $237,710 |
| 2019 | $6,945 | $294,990 | $50,870 | $244,120 |
| 2018 | $6,599 | $280,290 | $50,870 | $229,420 |
| 2017 | $6,926 | $290,580 | $50,870 | $239,710 |
| 2016 | $6,926 | $290,580 | $50,870 | $239,710 |
| 2015 | $5,788 | $277,570 | $50,870 | $226,700 |
| 2014 | $5,788 | $239,420 | $50,870 | $188,550 |
Source: Public Records
Map
Nearby Homes
- 30 Whetstone Ridge Way
- 133 E Montfair Blvd
- 137 E Montfair Blvd
- 90 Panterra Way
- 15 Fillgrove Place
- 9011 Breckenridge Dr
- 7 Stickley Ct
- 9203 Breckenridge Dr
- 86 Oriel Oaks Cir
- 54 N Veilwood Cir
- 119 Benedict Canyon Loop
- 31503 Agassi Ct
- 34 Gilmore Grove Place
- 6 Hithervale Ct
- 30 Player Green Place
- 22 Bryce Branch Cir
- 35 N Star Ridge Cir
- 115 Black Swan Place
- 79 N Gary Glen Cir
- 166 Hawkhurst Cir
- 67 Chipwyck Way
- 71 Chipwyck Way
- 59 Chipwyck Way
- 75 Chipwyck Way
- 55 Chipwyck Way
- 51 Chipwyck Way
- 79 Chipwyck Way
- 78 Whetstone Ridge Way
- 81 Whetstone Ridge Way
- 79 Whetstone Ridge Way
- 74 Whetstone Ridge Way
- 75 Whetstone Ridge Way
- 70 Whetstone Ridge Way
- 71 Whetstone Ridge Way
- 66 Whetstone Ridge Way
- 126 W Montfair Blvd
- 67 Whetstone Ridge Way
- 62 Whetstone Ridge Way
- 122 W Montfair Blvd
- 118 W Montfair Blvd