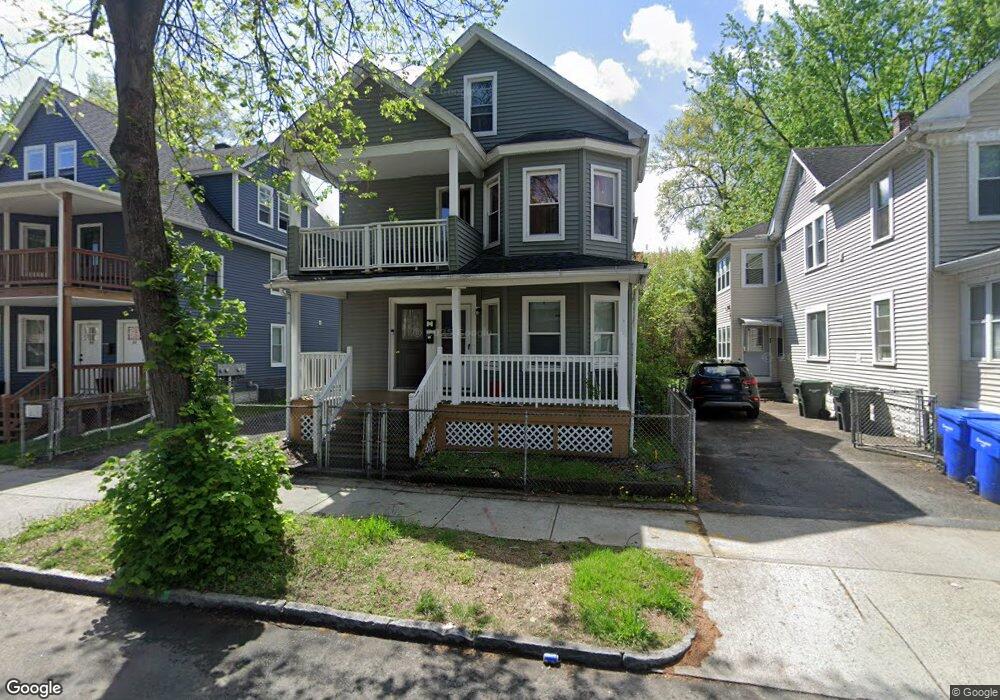
63 Clayton St Unit 65 Springfield, MA 01107
Brightwood NeighborhoodEstimated Value: $352,454 - $415,000
5
Beds
2
Baths
2,332
Sq Ft
$164/Sq Ft
Est. Value
About This Home
This home is located at 63 Clayton St Unit 65, Springfield, MA 01107 and is currently estimated at $383,364, approximately $164 per square foot. 63 Clayton St Unit 65 is a home located in Hampden County with nearby schools including High School Of Commerce, Springfield High School of Science and Technology, and Roger L. Putnam Vocational Technical Academy.
Ownership History
Date
Name
Owned For
Owner Type
Purchase Details
Closed on
Apr 22, 2022
Sold by
Shaver Ryan L and Malone Kevin A
Bought by
Malone Kevin A
Current Estimated Value
Home Financials for this Owner
Home Financials are based on the most recent Mortgage that was taken out on this home.
Original Mortgage
$192,000
Outstanding Balance
$179,868
Interest Rate
4.16%
Mortgage Type
New Conventional
Estimated Equity
$203,496
Purchase Details
Closed on
Nov 4, 2020
Sold by
Shaver Ryan
Bought by
Shaver Ryan L and Malone Kevin A
Purchase Details
Closed on
Jul 15, 2019
Sold by
Ridubois Peter
Bought by
Shaver Ryan
Home Financials for this Owner
Home Financials are based on the most recent Mortgage that was taken out on this home.
Original Mortgage
$140,802
Interest Rate
5.25%
Mortgage Type
FHA
Purchase Details
Closed on
Dec 19, 1996
Sold by
Maccarone Peter
Bought by
Ridubois Peter A
Home Financials for this Owner
Home Financials are based on the most recent Mortgage that was taken out on this home.
Original Mortgage
$41,922
Interest Rate
7.62%
Mortgage Type
Purchase Money Mortgage
Create a Home Valuation Report for This Property
The Home Valuation Report is an in-depth analysis detailing your home's value as well as a comparison with similar homes in the area
Home Values in the Area
Average Home Value in this Area
Purchase History
| Date | Buyer | Sale Price | Title Company |
|---|---|---|---|
| Malone Kevin A | -- | None Available | |
| Malone Kevin A | -- | None Available | |
| Shaver Ryan L | -- | None Available | |
| Shaver Ryan L | -- | None Available | |
| Shaver Ryan | $115,000 | -- | |
| Ridubois Peter A | $44,000 | -- | |
| Ridubois Peter A | $44,000 | -- |
Source: Public Records
Mortgage History
| Date | Status | Borrower | Loan Amount |
|---|---|---|---|
| Open | Malone Kevin A | $192,000 | |
| Closed | Malone Kevin A | $192,000 | |
| Previous Owner | Shaver Ryan | $140,802 | |
| Previous Owner | Ridubois Peter A | $41,922 |
Source: Public Records
Tax History Compared to Growth
Tax History
| Year | Tax Paid | Tax Assessment Tax Assessment Total Assessment is a certain percentage of the fair market value that is determined by local assessors to be the total taxable value of land and additions on the property. | Land | Improvement |
|---|---|---|---|---|
| 2025 | $4,975 | $317,300 | $29,700 | $287,600 |
| 2024 | $4,603 | $286,600 | $29,700 | $256,900 |
| 2023 | $3,681 | $215,900 | $27,000 | $188,900 |
| 2022 | $3,237 | $172,000 | $25,300 | $146,700 |
| 2021 | $3,018 | $159,700 | $23,000 | $136,700 |
| 2020 | $2,644 | $135,400 | $23,000 | $112,400 |
| 2019 | $2,352 | $119,500 | $23,000 | $96,500 |
| 2018 | $2,279 | $115,800 | $23,000 | $92,800 |
| 2017 | $2,255 | $114,700 | $17,200 | $97,500 |
| 2016 | $1,785 | $90,800 | $17,200 | $73,600 |
| 2015 | $1,764 | $89,700 | $17,200 | $72,500 |
Source: Public Records
Map
Nearby Homes
- 51-53 Abbe Ave
- 50 Newland St
- 62 Washburn St
- 78 Lowell St
- 2942-2946 Main St
- 917 Elm St
- 1304 Elm St Unit 4C
- 49-53 Jefferson Ave
- 334 Elm St
- 147 Grandview Ave
- 196 Massasoit St
- 56 Montmorenci St
- 60 Montmorenci St
- 195-197 Massasoit St
- 32 Windpath E
- 13 Ringgold St
- 57 Narragansett St
- 482 Chestnut St
- 92 Grove St
- 24 Cunningham St
- 111 Clayton St
- 67 Clayton St Unit 69
- 109 Clayton St
- 59-61 Clayton St
- 59 Clayton St Unit 61
- 73 Clayton St
- 53 Clayton St Unit 55
- 77 Clayton St
- 51 Clayton St
- 66 Clayton St Unit 68
- 83 Clayton St
- 70 Clayton St Unit 72
- 60 Clayton St
- 76 Clayton St
- 43 Clayton St Unit 45
- 43-45 Clayton St
- 85 Clayton St
- 50 Clayton St
- 41 Clayton St
- 91 Clayton St