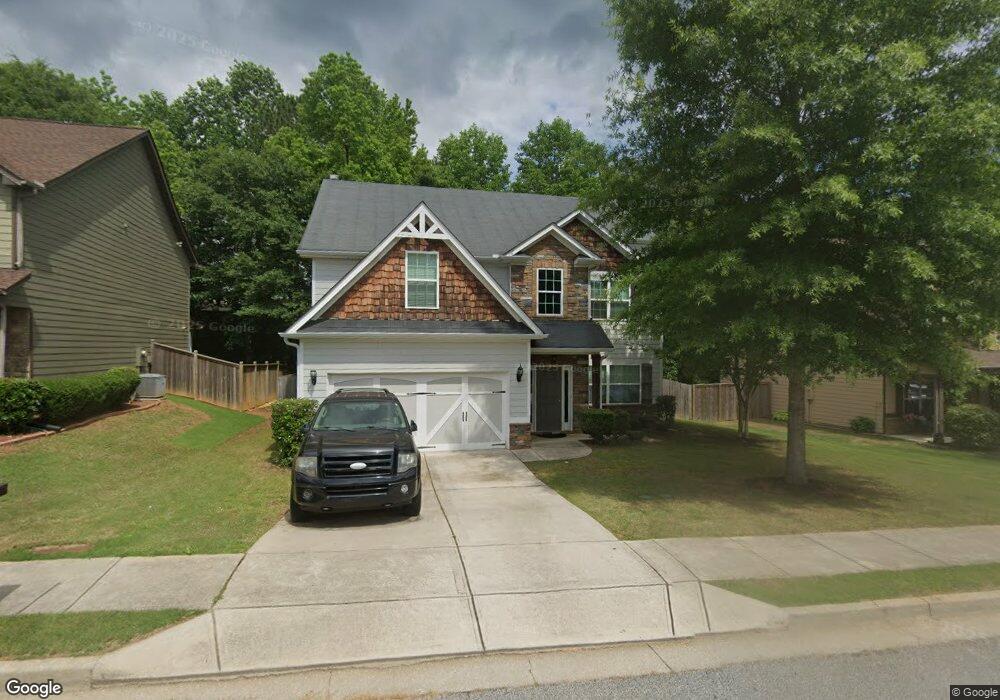
63 Cliffhaven Cir Unit 89 Newnan, GA 30263
Estimated Value: $376,772 - $423,000
4
Beds
3
Baths
2,347
Sq Ft
$172/Sq Ft
Est. Value
About This Home
This home is located at 63 Cliffhaven Cir Unit 89, Newnan, GA 30263 and is currently estimated at $403,943, approximately $172 per square foot. 63 Cliffhaven Cir Unit 89 is a home located in Coweta County with nearby schools including Newnan Crossing Elementary School, Arnall Middle School, and East Coweta High School.
Ownership History
Date
Name
Owned For
Owner Type
Purchase Details
Closed on
Dec 14, 2023
Sold by
United States Veterans Affairs
Bought by
Deen Matthew Byron
Current Estimated Value
Purchase Details
Closed on
Jul 26, 2017
Sold by
Not Provided
Bought by
Progress Residential Borrower
Purchase Details
Closed on
Sep 15, 2016
Sold by
Benjamin A
Bought by
Freo Georgia Llc
Purchase Details
Closed on
Jul 23, 2014
Sold by
Edgar Hughston Builder Inc
Bought by
Robbins Benjamin A
Home Financials for this Owner
Home Financials are based on the most recent Mortgage that was taken out on this home.
Original Mortgage
$187,425
Interest Rate
4.19%
Mortgage Type
New Conventional
Purchase Details
Closed on
Aug 8, 2012
Sold by
Mp Investment Properties L
Bought by
Edgar Hughston Builder Inc
Purchase Details
Closed on
Jan 21, 2004
Sold by
Mp Investment Properties Llc
Bought by
Mp Investment Properties Llc
Create a Home Valuation Report for This Property
The Home Valuation Report is an in-depth analysis detailing your home's value as well as a comparison with similar homes in the area
Home Values in the Area
Average Home Value in this Area
Purchase History
| Date | Buyer | Sale Price | Title Company |
|---|---|---|---|
| Deen Matthew Byron | $379,500 | -- | |
| Progress Residential Borrower | -- | -- | |
| Freo Georgia Llc | $211,000 | -- | |
| Robbins Benjamin A | $197,300 | -- | |
| Edgar Hughston Builder Inc | $630,000 | -- | |
| Mp Investment Properties Llc | -- | -- |
Source: Public Records
Mortgage History
| Date | Status | Borrower | Loan Amount |
|---|---|---|---|
| Previous Owner | Robbins Benjamin A | $187,425 |
Source: Public Records
Tax History Compared to Growth
Tax History
| Year | Tax Paid | Tax Assessment Tax Assessment Total Assessment is a certain percentage of the fair market value that is determined by local assessors to be the total taxable value of land and additions on the property. | Land | Improvement |
|---|---|---|---|---|
| 2024 | $3,487 | $152,593 | $30,000 | $122,593 |
| 2023 | $3,487 | $138,658 | $22,000 | $116,658 |
| 2022 | $3,451 | $125,338 | $14,000 | $111,338 |
| 2021 | $3,271 | $107,732 | $14,000 | $93,732 |
| 2020 | $3,345 | $111,570 | $14,000 | $97,570 |
| 2019 | $3,133 | $91,451 | $16,000 | $75,451 |
| 2018 | $2,764 | $91,451 | $16,000 | $75,451 |
| 2017 | $3,051 | $88,977 | $16,000 | $72,977 |
| 2016 | $2,475 | $82,214 | $8,000 | $74,214 |
| 2015 | $2,200 | $72,937 | $8,000 | $64,937 |
| 2014 | $140 | $8,000 | $8,000 | $0 |
Source: Public Records
Map
Nearby Homes
- 84 Hidden Lakes Ct
- 145 Greison Trail
- 118 Newnan Lakes Blvd
- 139 Greison Trail
- Springdale Plan at The Retreat at Brown's Ridge - The Retreat at Browns Ridge
- Boxwood Plan at The Retreat at Brown's Ridge - The Retreat at Browns Ridge
- Emory Plan at The Retreat at Brown's Ridge - The Retreat at Browns Ridge
- McIntosh Plan at The Retreat at Brown's Ridge - The Retreat at Browns Ridge
- Sullivan Plan at The Retreat at Brown's Ridge - The Retreat at Browns Ridge
- Bramblewood Plan at The Retreat at Brown's Ridge - The Retreat at Browns Ridge
- Waterford Plan at The Retreat at Brown's Ridge - The Retreat at Browns Ridge
- 21 Thomaston St Unit 5
- 39 Covington Terrace
- 35 Hidden Lakes Dr
- 21 Umber Ln Unit LOT 24
- 22 Umber Ln Unit LOT 8
- 23 Umber Ln Unit LOT 23
- 19 Umber Ln Unit LOT 25
- 17 Umber Ln Unit LOT 26
- 8 Umber Ln Unit LOT 2
- 63 Cliffhaven Cir
- 63 Cliffhaven Cir Unit 2
- 59 Cliffhaven Cir Unit 1
- 59 Cliffhaven Cir Unit 90
- 67 Cliffhaven Cir Unit 88
- 67 Cliffhaven Cir
- 67 Cliffhaven Cir Unit 2
- 55 Cliffhaven Cir Unit 91
- 55 Cliffhaven Cir
- 71 Cliffhaven Cir
- 71 Cliffhaven Cir Unit 163
- 71 Cliffhaven Cir
- 71 Cliffhaven Cir Unit 3
- 71 Cliffhaven Cir Unit 87
- 2 Worcester Unit 127
- 3 Worcester Dr Unit LT 128
- 2 Worcester
- 10 Worcester Unit 125
- 14 Worcester Unit 124
- 10 Worcester Unit 4