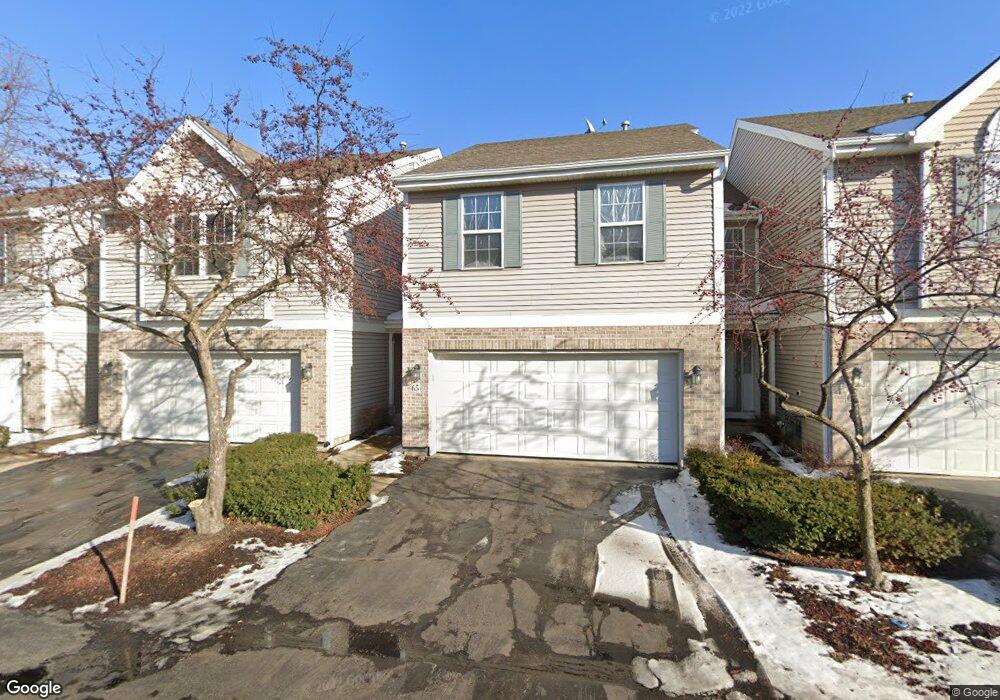
63 Colonial Ct Streamwood, IL 60107
Estimated Value: $331,000 - $344,000
3
Beds
3
Baths
1,860
Sq Ft
$182/Sq Ft
Est. Value
About This Home
This home is located at 63 Colonial Ct, Streamwood, IL 60107 and is currently estimated at $338,861, approximately $182 per square foot. 63 Colonial Ct is a home located in Cook County with nearby schools including Hanover Countryside Elementary School, Canton Middle School, and Streamwood High School.
Ownership History
Date
Name
Owned For
Owner Type
Purchase Details
Closed on
Aug 16, 2018
Sold by
Patel Dikesh and Patel Khyati
Bought by
Tailor Pratik and Tailor Heenal
Current Estimated Value
Home Financials for this Owner
Home Financials are based on the most recent Mortgage that was taken out on this home.
Original Mortgage
$173,600
Outstanding Balance
$150,225
Interest Rate
4.62%
Mortgage Type
New Conventional
Estimated Equity
$188,636
Purchase Details
Closed on
Nov 10, 2010
Sold by
Rusch Dolores M
Bought by
Patel Dikesh and Patel Khyati
Home Financials for this Owner
Home Financials are based on the most recent Mortgage that was taken out on this home.
Original Mortgage
$136,000
Interest Rate
4.12%
Mortgage Type
New Conventional
Purchase Details
Closed on
Nov 17, 2000
Sold by
Colonial Enterprises Inc
Bought by
Hacz Adam and Hacz Grazyna
Home Financials for this Owner
Home Financials are based on the most recent Mortgage that was taken out on this home.
Original Mortgage
$141,000
Interest Rate
7.18%
Create a Home Valuation Report for This Property
The Home Valuation Report is an in-depth analysis detailing your home's value as well as a comparison with similar homes in the area
Home Values in the Area
Average Home Value in this Area
Purchase History
| Date | Buyer | Sale Price | Title Company |
|---|---|---|---|
| Tailor Pratik | $217,000 | Old Republic Title | |
| Patel Dikesh | $170,000 | Heritage Title Company | |
| Hacz Adam | $189,500 | -- |
Source: Public Records
Mortgage History
| Date | Status | Borrower | Loan Amount |
|---|---|---|---|
| Open | Tailor Pratik | $173,600 | |
| Previous Owner | Patel Dikesh | $136,000 | |
| Previous Owner | Hacz Adam | $141,000 |
Source: Public Records
Tax History
| Year | Tax Paid | Tax Assessment Tax Assessment Total Assessment is a certain percentage of the fair market value that is determined by local assessors to be the total taxable value of land and additions on the property. | Land | Improvement |
|---|---|---|---|---|
| 2025 | $6,265 | $32,000 | $811 | $31,189 |
| 2024 | $6,265 | $25,000 | $3,000 | $22,000 |
| 2023 | $6,082 | $25,000 | $3,000 | $22,000 |
| 2022 | $6,082 | $25,000 | $3,000 | $22,000 |
| 2021 | $5,039 | $18,025 | $777 | $17,248 |
| 2020 | $5,034 | $18,025 | $777 | $17,248 |
| 2019 | $4,986 | $20,028 | $777 | $19,251 |
| 2018 | $5,361 | $19,648 | $676 | $18,972 |
| 2017 | $7,257 | $25,595 | $676 | $24,919 |
| 2016 | $7,044 | $25,595 | $676 | $24,919 |
| 2015 | $7,051 | $21,132 | $608 | $20,524 |
| 2014 | $6,939 | $21,132 | $608 | $20,524 |
| 2013 | $6,726 | $21,132 | $608 | $20,524 |
Source: Public Records
Map
Nearby Homes
- 122 Brittany Dr Unit 16C2
- 105 Heritage Ln Unit 173T105
- 107 W Streamwood Blvd
- 12 E Pine St
- 1108 Oak Ridge Dr
- 134 Virginia Ct
- 820 S Pine St
- 62 Washington Ave
- 741 W Streamwood Blvd Unit A
- 745 W Streamwood Blvd Unit B
- 132 Meredith Ln Unit 63
- 6 Dartmouth Ct
- 11 E Streamwood Blvd
- 1341 Beverly Ln
- 128 Fairview Ln
- 158 Jefferson Ln
- 26 Blue Stem Ct Unit 32
- 2074 Essex Ct Unit 2074
- 111 Cedar Cir
- 110 Cedar Cir
- 65 Colonial Ct
- 61 Colonial Ct
- 67 Colonial Ct
- 45 Colonial Ct
- 43 Colonial Ct
- 47 Colonial Ct
- 41 Colonial Ct
- 49 Colonial Ct
- 57 Colonial Ct
- 55 Colonial Ct
- 126 Brittany Dr Unit 16E2
- 110 Brittany Dr Unit 17C1
- 108 Brittany Dr Unit 17D1
- 128 Brittany Dr Unit E
- 128 Brittany Dr Unit 16E1
- 53 Colonial Ct
- 104 Brittany Dr Unit 17E2
- 130 Brittany Dr Unit 16D1
- 102 Brittany Dr Unit 17D2
Your Personal Tour Guide
Ask me questions while you tour the home.