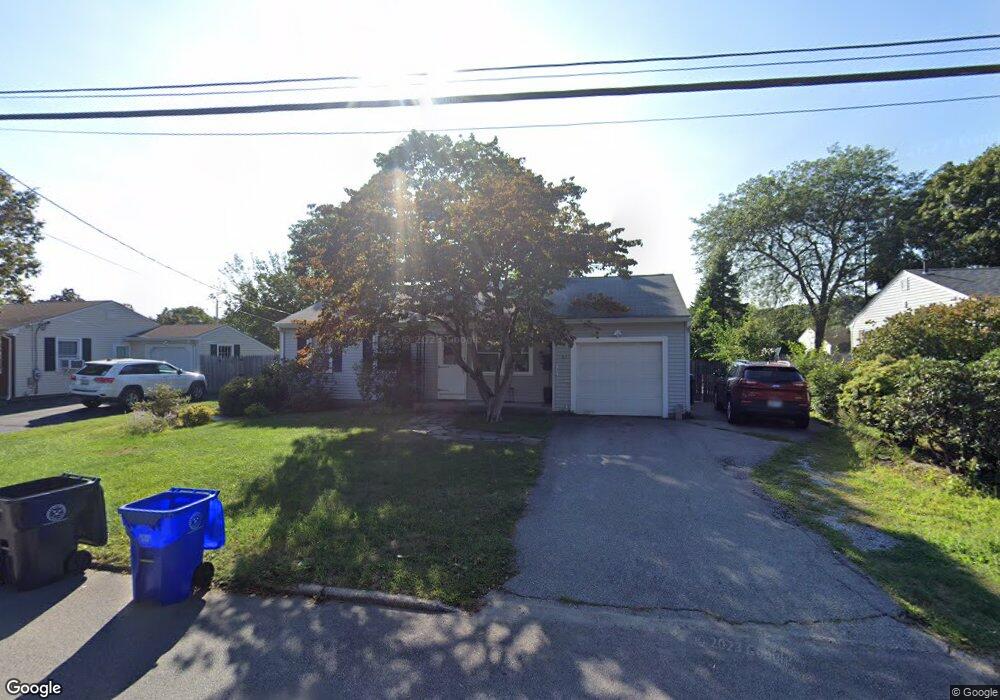
63 Colony Rd Riverside, RI 02915
Riverside NeighborhoodEstimated Value: $416,657 - $446,000
3
Beds
1
Bath
1,096
Sq Ft
$394/Sq Ft
Est. Value
About This Home
This home is located at 63 Colony Rd, Riverside, RI 02915 and is currently estimated at $431,664, approximately $393 per square foot. 63 Colony Rd is a home located in Providence County with nearby schools including East Providence High School, St Luke Elementary School, and Barrington Christian Academy.
Ownership History
Date
Name
Owned For
Owner Type
Purchase Details
Closed on
Sep 28, 2020
Sold by
Jane A Nelson Lt
Bought by
Fasano Andrew and Pouliot Kaitlyn
Current Estimated Value
Home Financials for this Owner
Home Financials are based on the most recent Mortgage that was taken out on this home.
Original Mortgage
$237,600
Outstanding Balance
$210,854
Interest Rate
2.9%
Mortgage Type
New Conventional
Estimated Equity
$220,810
Create a Home Valuation Report for This Property
The Home Valuation Report is an in-depth analysis detailing your home's value as well as a comparison with similar homes in the area
Home Values in the Area
Average Home Value in this Area
Purchase History
| Date | Buyer | Sale Price | Title Company |
|---|---|---|---|
| Fasano Andrew | $264,000 | None Available |
Source: Public Records
Mortgage History
| Date | Status | Borrower | Loan Amount |
|---|---|---|---|
| Open | Fasano Andrew | $237,600 |
Source: Public Records
Tax History
| Year | Tax Paid | Tax Assessment Tax Assessment Total Assessment is a certain percentage of the fair market value that is determined by local assessors to be the total taxable value of land and additions on the property. | Land | Improvement |
|---|---|---|---|---|
| 2025 | $4,920 | $376,400 | $124,100 | $252,300 |
| 2024 | $4,973 | $324,400 | $103,400 | $221,000 |
| 2023 | $4,788 | $324,400 | $103,400 | $221,000 |
| 2022 | $4,626 | $211,600 | $52,000 | $159,600 |
| 2021 | $4,549 | $211,600 | $52,000 | $159,600 |
| 2020 | $4,357 | $211,600 | $52,000 | $159,600 |
| 2019 | $4,236 | $211,600 | $52,000 | $159,600 |
| 2018 | $4,169 | $182,200 | $63,400 | $118,800 |
| 2017 | $4,076 | $182,200 | $63,400 | $118,800 |
| 2016 | $4,056 | $182,200 | $63,400 | $118,800 |
| 2015 | $3,986 | $173,700 | $53,600 | $120,100 |
| 2014 | $3,986 | $173,700 | $53,600 | $120,100 |
Source: Public Records
Map
Nearby Homes
Your Personal Tour Guide
Ask me questions while you tour the home.