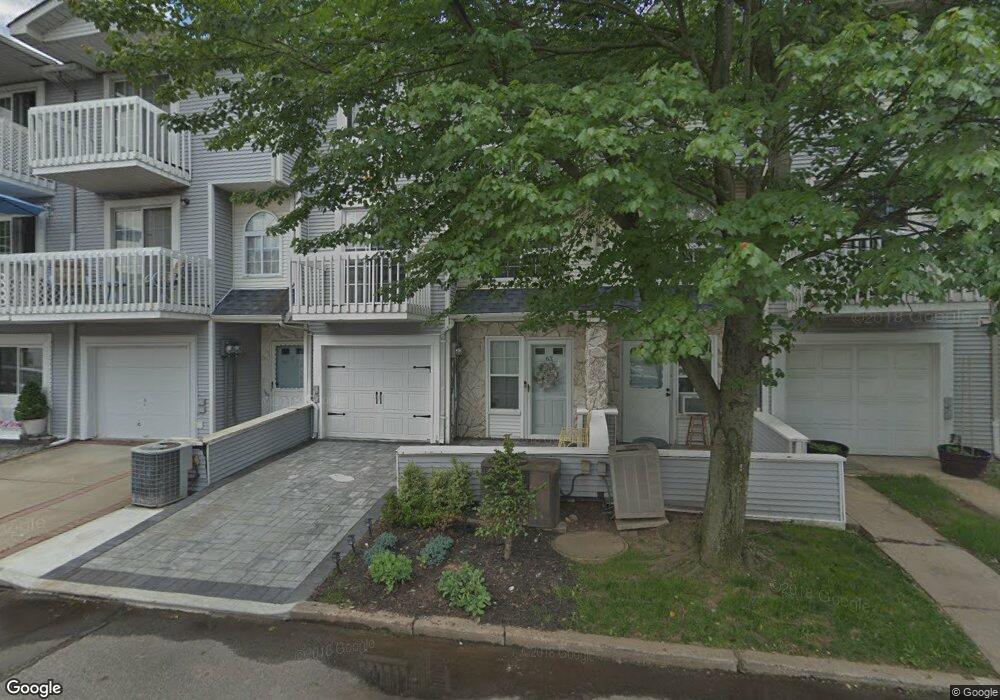
63 Country Dr E Unit 60 Staten Island, NY 10314
New Springville NeighborhoodEstimated Value: $514,088 - $548,000
2
Beds
2
Baths
1,230
Sq Ft
$429/Sq Ft
Est. Value
About This Home
This home is located at 63 Country Dr E Unit 60, Staten Island, NY 10314 and is currently estimated at $528,272, approximately $429 per square foot. 63 Country Dr E Unit 60 is a home located in Richmond County with nearby schools including P.S. 69 - Daniel D. Tompkins, Is 72 Rocco Laurie, and Port Richmond High School.
Ownership History
Date
Name
Owned For
Owner Type
Purchase Details
Closed on
Mar 16, 2022
Sold by
Newell Charece S
Bought by
Sashenee Legacy Trust and Newell
Current Estimated Value
Purchase Details
Closed on
Apr 22, 2008
Sold by
Chong Seon Joo
Bought by
Newell Charence
Home Financials for this Owner
Home Financials are based on the most recent Mortgage that was taken out on this home.
Original Mortgage
$295,500
Interest Rate
5.99%
Mortgage Type
Purchase Money Mortgage
Purchase Details
Closed on
Feb 8, 2008
Sold by
Chong Hee Sop and Chong Seon Joo
Bought by
Chong Seon Joo
Purchase Details
Closed on
Apr 20, 2004
Sold by
Demaio Rose
Bought by
Chong Hee Sop and Chong Seon Joo
Home Financials for this Owner
Home Financials are based on the most recent Mortgage that was taken out on this home.
Original Mortgage
$200,000
Interest Rate
5.12%
Mortgage Type
Purchase Money Mortgage
Create a Home Valuation Report for This Property
The Home Valuation Report is an in-depth analysis detailing your home's value as well as a comparison with similar homes in the area
Home Values in the Area
Average Home Value in this Area
Purchase History
| Date | Buyer | Sale Price | Title Company |
|---|---|---|---|
| Sashenee Legacy Trust | -- | None Listed On Document | |
| Newell Charence | $311,060 | None Available | |
| Chong Seon Joo | -- | The Judicial Title Insurance | |
| Chong Hee Sop | $250,000 | The Judicial Title Insurance |
Source: Public Records
Mortgage History
| Date | Status | Borrower | Loan Amount |
|---|---|---|---|
| Previous Owner | Newell Charence | $295,500 | |
| Previous Owner | Chong Hee Sop | $200,000 |
Source: Public Records
Tax History Compared to Growth
Tax History
| Year | Tax Paid | Tax Assessment Tax Assessment Total Assessment is a certain percentage of the fair market value that is determined by local assessors to be the total taxable value of land and additions on the property. | Land | Improvement |
|---|---|---|---|---|
| 2025 | $3,091 | $31,197 | $1,206 | $29,991 |
| 2024 | $3,091 | $28,123 | $1,327 | $26,796 |
| 2023 | $2,949 | $14,519 | $1,242 | $13,277 |
| 2022 | $2,735 | $25,247 | $2,425 | $22,822 |
| 2021 | $2,720 | $23,098 | $2,425 | $20,673 |
| 2020 | $2,736 | $21,550 | $2,425 | $19,125 |
| 2019 | $2,683 | $18,750 | $2,425 | $16,325 |
| 2018 | $2,466 | $12,099 | $1,655 | $10,444 |
| 2017 | $2,327 | $11,415 | $1,694 | $9,721 |
| 2016 | $2,153 | $10,771 | $1,734 | $9,037 |
| 2015 | $2,051 | $10,771 | $1,760 | $9,011 |
| 2014 | $2,051 | $10,687 | $1,636 | $9,051 |
Source: Public Records
Map
Nearby Homes
- 35 Country Dr N Unit 10
- 35 Country Dr N Unit A
- 45A Country Dr E Unit 71
- 38A Country Dr E Unit 41
- 34 Country Dr E Unit A45
- 65 Country Dr N Unit A
- 31 Country Dr S Unit 48
- 80 Country Dr N
- 178 Vassar St
- 323 Merrymount St
- 20 Racal Ct Unit A2
- 51 Shiloh St
- 150 Richmond Hill Rd Unit 179
- 60 Lamped Loop Unit 125
- 9 Radford St
- 75 Villa Nova St
- 26 Gardenia Ln Unit 95
- 26A Gardenia Ln Unit 96
- 228 Nome Ave
- 766 Klondike Ave
- 61 Country Dr E Unit 62
- 63A Country Dr E Unit 59
- 61 Country Dr E Unit A
- 63 Country Dr E Unit 1
- 63 Country Dr E Unit A
- 59 Country Dr E Unit 16
- 65 Country Dr E Unit 58
- 65 Country Dr E Unit A
- 67 Country Dr E Unit 56
- 67 Country Dr E Unit 84
- 67 Country Dr E Unit A
- 69 Country Dr E Unit 54
- 69 Country Dr E Unit 53
- 69 Country Dr E Unit 69A
- 69 Country Dr E Unit A
- 266 Merrymount St
- 264 Merrymount St
- 270 Merrymount St
- 71 Country Dr E Unit 52
- 71A Country Dr E Unit 51