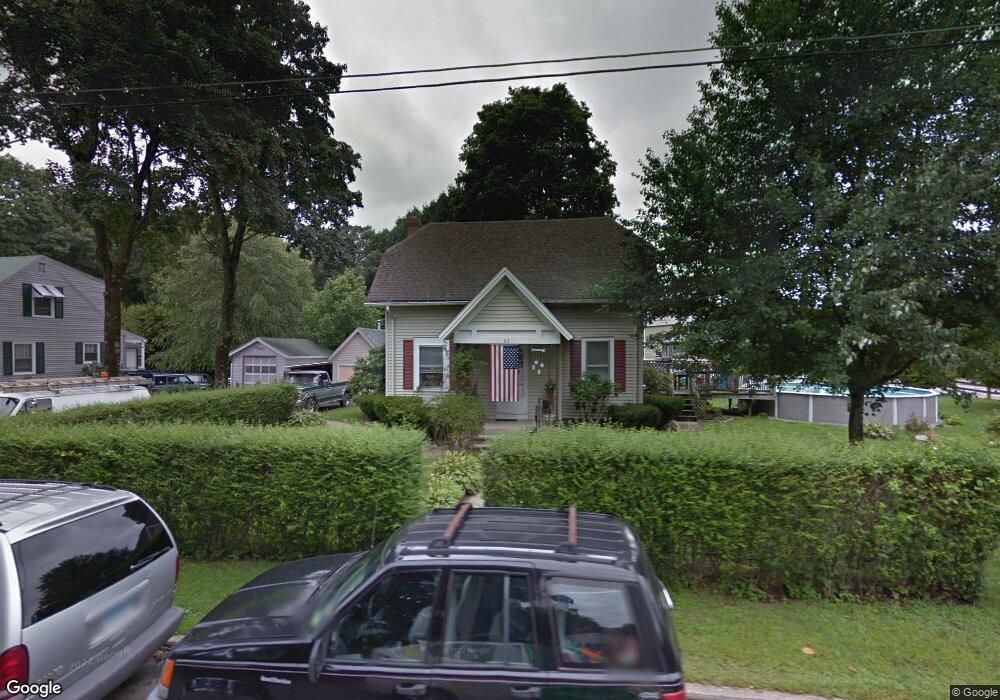
63 Crescent St Willimantic, CT 06226
Estimated Value: $258,000 - $272,000
3
Beds
1
Bath
1,195
Sq Ft
$222/Sq Ft
Est. Value
About This Home
This home is located at 63 Crescent St, Willimantic, CT 06226 and is currently estimated at $265,337, approximately $222 per square foot. 63 Crescent St is a home located in Windham County with nearby schools including Windham Middle School, Windham High School, and St Mary St Joseph School.
Ownership History
Date
Name
Owned For
Owner Type
Purchase Details
Closed on
Oct 22, 2002
Sold by
Hooper Herbert F and Hooper Elizabeth M
Bought by
Hooper Jason
Current Estimated Value
Home Financials for this Owner
Home Financials are based on the most recent Mortgage that was taken out on this home.
Original Mortgage
$68,005
Outstanding Balance
$28,552
Interest Rate
6.18%
Mortgage Type
Purchase Money Mortgage
Estimated Equity
$236,785
Purchase Details
Closed on
Oct 14, 1994
Sold by
Gantick Noel
Bought by
Hooper Herbert and Hooper Elizabeth
Home Financials for this Owner
Home Financials are based on the most recent Mortgage that was taken out on this home.
Original Mortgage
$47,000
Interest Rate
8.43%
Mortgage Type
Purchase Money Mortgage
Create a Home Valuation Report for This Property
The Home Valuation Report is an in-depth analysis detailing your home's value as well as a comparison with similar homes in the area
Home Values in the Area
Average Home Value in this Area
Purchase History
| Date | Buyer | Sale Price | Title Company |
|---|---|---|---|
| Hooper Jason | $90,000 | -- | |
| Hooper Herbert | $50,000 | -- |
Source: Public Records
Mortgage History
| Date | Status | Borrower | Loan Amount |
|---|---|---|---|
| Open | Hooper Herbert | $68,005 | |
| Previous Owner | Hooper Herbert | $47,000 |
Source: Public Records
Tax History
| Year | Tax Paid | Tax Assessment Tax Assessment Total Assessment is a certain percentage of the fair market value that is determined by local assessors to be the total taxable value of land and additions on the property. | Land | Improvement |
|---|---|---|---|---|
| 2025 | $5,286 | $142,790 | $28,250 | $114,540 |
| 2024 | $5,292 | $142,790 | $28,250 | $114,540 |
| 2023 | $3,996 | $84,310 | $24,570 | $59,740 |
| 2022 | $3,937 | $84,310 | $24,570 | $59,740 |
| 2021 | $4,223 | $84,310 | $24,570 | $59,740 |
| 2020 | $4,214 | $84,310 | $24,570 | $59,740 |
| 2019 | $4,146 | $84,310 | $24,570 | $59,740 |
| 2017 | $3,802 | $79,860 | $19,390 | $60,470 |
| 2015 | $3,672 | $79,860 | $19,390 | $60,470 |
| 2014 | $3,468 | $79,860 | $19,390 | $60,470 |
Source: Public Records
Map
Nearby Homes
Your Personal Tour Guide
Ask me questions while you tour the home.