63 Crest Rd Monson, MA 01057
Estimated Value: $367,000 - $428,000
3
Beds
1
Bath
1,451
Sq Ft
$268/Sq Ft
Est. Value
About This Home
This home is located at 63 Crest Rd, Monson, MA 01057 and is currently estimated at $388,529, approximately $267 per square foot. 63 Crest Rd is a home located in Hampden County with nearby schools including Quarry Hill Community School, Granite Valley School, and Monson High School.
Ownership History
Date
Name
Owned For
Owner Type
Purchase Details
Closed on
Sep 13, 2019
Sold by
Staback Rose M
Bought by
Staback Christine and Staback Michael
Current Estimated Value
Create a Home Valuation Report for This Property
The Home Valuation Report is an in-depth analysis detailing your home's value as well as a comparison with similar homes in the area
Home Values in the Area
Average Home Value in this Area
Purchase History
| Date | Buyer | Sale Price | Title Company |
|---|---|---|---|
| Staback Christine | -- | -- |
Source: Public Records
Tax History Compared to Growth
Tax History
| Year | Tax Paid | Tax Assessment Tax Assessment Total Assessment is a certain percentage of the fair market value that is determined by local assessors to be the total taxable value of land and additions on the property. | Land | Improvement |
|---|---|---|---|---|
| 2025 | $4,128 | $277,600 | $56,000 | $221,600 |
| 2024 | $4,010 | $258,700 | $56,000 | $202,700 |
| 2023 | $3,729 | $235,100 | $56,000 | $179,100 |
| 2022 | $3,596 | $201,700 | $56,000 | $145,700 |
| 2021 | $3,352 | $185,000 | $56,000 | $129,000 |
| 2020 | $3,380 | $185,000 | $56,000 | $129,000 |
| 2019 | $3,241 | $176,700 | $56,000 | $120,700 |
| 2018 | $3,120 | $177,300 | $62,200 | $115,100 |
| 2017 | $2,975 | $170,900 | $59,900 | $111,000 |
| 2016 | $2,945 | $172,000 | $59,700 | $112,300 |
| 2015 | $2,867 | $172,000 | $59,700 | $112,300 |
| 2014 | $2,786 | $172,000 | $59,700 | $112,300 |
Source: Public Records
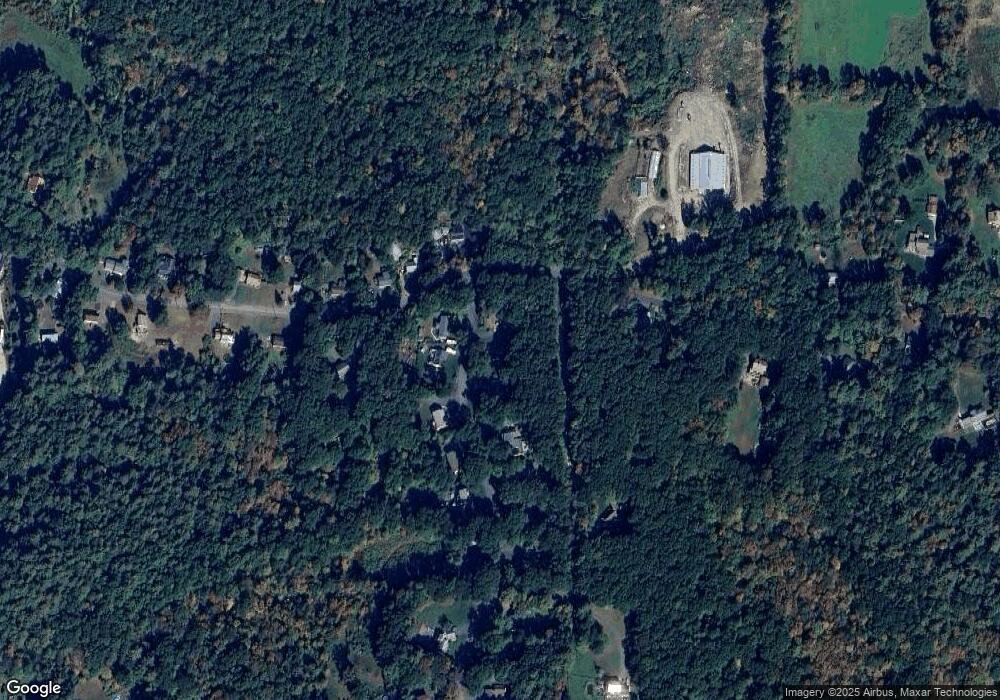
Map
Nearby Homes
- 22 Beebe Rd
- 0 Bethany Rd
- 0 Palmer Rd
- 26 Brimfield Rd
- Lot B Brimfield Rd
- 124 Brimfield Rd
- 18 Palmer Rd Unit 15
- 18 Palmer Rd Unit 6
- 155 Brimfield Rd
- 6 Old Reed Rd
- 4 Stewart Ave
- 11V Old Reed Rd
- 1 Heritage Ln
- 4 Spring St
- 56 Margaret St
- 23 High St
- 21 High St
- 0 Mccray Cir
- 12 Upper Palmer Rd
- 268 Palmer Rd Unit 59