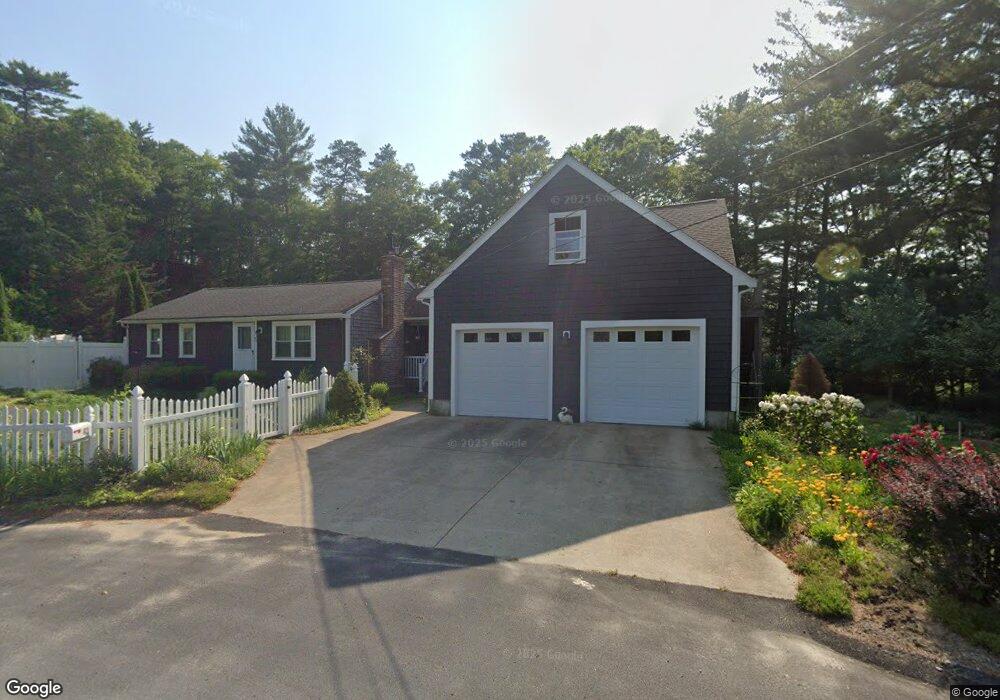
63 Davenport Rd Plymouth, MA 02360
Estimated Value: $457,000 - $541,000
2
Beds
1
Bath
21,000
Sq Ft
$24/Sq Ft
Est. Value
About This Home
This home is located at 63 Davenport Rd, Plymouth, MA 02360 and is currently estimated at $505,089, approximately $24 per square foot. 63 Davenport Rd is a home located in Plymouth County with nearby schools including Manomet Elementary School, Plymouth Community Intermediate, and Plymouth North High School.
Ownership History
Date
Name
Owned For
Owner Type
Purchase Details
Closed on
Dec 20, 2000
Sold by
Department Of Housing & Urban Dev and Citiwest New England
Bought by
Berardi Forrest R and Berardi Rose M
Current Estimated Value
Purchase Details
Closed on
Aug 17, 2000
Sold by
Countrywide Home Loans
Bought by
Department Of Housing & Urban Dev
Purchase Details
Closed on
Apr 10, 2000
Sold by
Haskins William J and Haskins Danielle K
Bought by
Countrywide Home Loan
Purchase Details
Closed on
Jun 20, 1997
Sold by
Wahlberg Arthur S and Wahlberg Rosemary
Bought by
Haskins William J and Haskins Danielle K
Purchase Details
Closed on
Feb 2, 1996
Sold by
Wsi Inc
Bought by
Wahlberg Arthur S and Wahlberg Rosemary
Purchase Details
Closed on
May 27, 1994
Sold by
Kelly Lawrence J and Kelly Doreen A
Bought by
First Union Nb
Create a Home Valuation Report for This Property
The Home Valuation Report is an in-depth analysis detailing your home's value as well as a comparison with similar homes in the area
Home Values in the Area
Average Home Value in this Area
Purchase History
| Date | Buyer | Sale Price | Title Company |
|---|---|---|---|
| Berardi Forrest R | $142,157 | -- | |
| Department Of Housing & Urban Dev | $138,000 | -- | |
| Countrywide Home Loan | $138,000 | -- | |
| Haskins William J | $110,000 | -- | |
| Wahlberg Arthur S | $60,000 | -- | |
| First Union Nb | $66,500 | -- | |
| First Union Nb | $66,500 | -- |
Source: Public Records
Mortgage History
| Date | Status | Borrower | Loan Amount |
|---|---|---|---|
| Open | First Union Nb | $4,000 | |
| Open | First Union Nb | $10,000 |
Source: Public Records
Tax History Compared to Growth
Tax History
| Year | Tax Paid | Tax Assessment Tax Assessment Total Assessment is a certain percentage of the fair market value that is determined by local assessors to be the total taxable value of land and additions on the property. | Land | Improvement |
|---|---|---|---|---|
| 2025 | $5,740 | $452,300 | $222,600 | $229,700 |
| 2024 | $5,404 | $419,900 | $202,700 | $217,200 |
| 2023 | $5,293 | $386,100 | $183,700 | $202,400 |
| 2022 | $5,070 | $328,600 | $173,200 | $155,400 |
| 2021 | $5,014 | $310,300 | $173,200 | $137,100 |
| 2020 | $4,799 | $293,500 | $157,500 | $136,000 |
| 2019 | $4,620 | $279,300 | $147,000 | $132,300 |
| 2018 | $4,403 | $267,500 | $136,500 | $131,000 |
| 2017 | $4,281 | $258,200 | $136,500 | $121,700 |
| 2016 | $4,050 | $248,900 | $126,000 | $122,900 |
| 2015 | $3,803 | $244,700 | $120,700 | $124,000 |
| 2014 | $3,664 | $242,200 | $120,700 | $121,500 |
Source: Public Records
Map
Nearby Homes
- 11 April Way
- 18 Highview Rd
- 0 Bogside Dr
- 39 Miter Dr Unit 8-1
- 82 Miter Dr Unit 2-1
- 221 Beaver Dam Rd
- 221 Beaver Dam Rd Unit 1
- 115 Andrews Way
- 79 Miter Dr Unit 7-2
- 87 Miter Dr Unit 6-1
- 88 Miter Dr Unit 1-1
- 90 Miter Dr Unit 1-3
- 83 Miter Dr Unit 6-3
- 81 Miter Dr Unit 7-1
- 91 Miter Dr Unit 18-1
- 91 Miter Dr Unit 16-1
- 91 Miter Dr Unit 18-2
- 91 Miter Dr Unit 16-3
- The Hickory Plan at Alden's Reach - Attached & Detached Single Family Homes
- The Pine Plan at Alden's Reach - Attached & Detached Single Family Homes
- 64 Davenport Rd
- 59 Davenport Rd
- 58 Davenport Rd
- 55 Davenport Rd
- 54 Davenport Rd
- 51 Davenport Rd
- 50 Davenport Rd
- 47 Davenport Rd
- 46 Davenport Rd
- 43 Davenport Rd
- 42 Davenport Rd
- 39 Davenport Rd
- 38 Davenport Rd
- 22 October Ln
- 35 Davenport Rd
- 34 Davenport Rd
- 16 October Ln
- 31 Davenport Rd
- 1 Carolyn Dr
- 1 Carolyn Dr