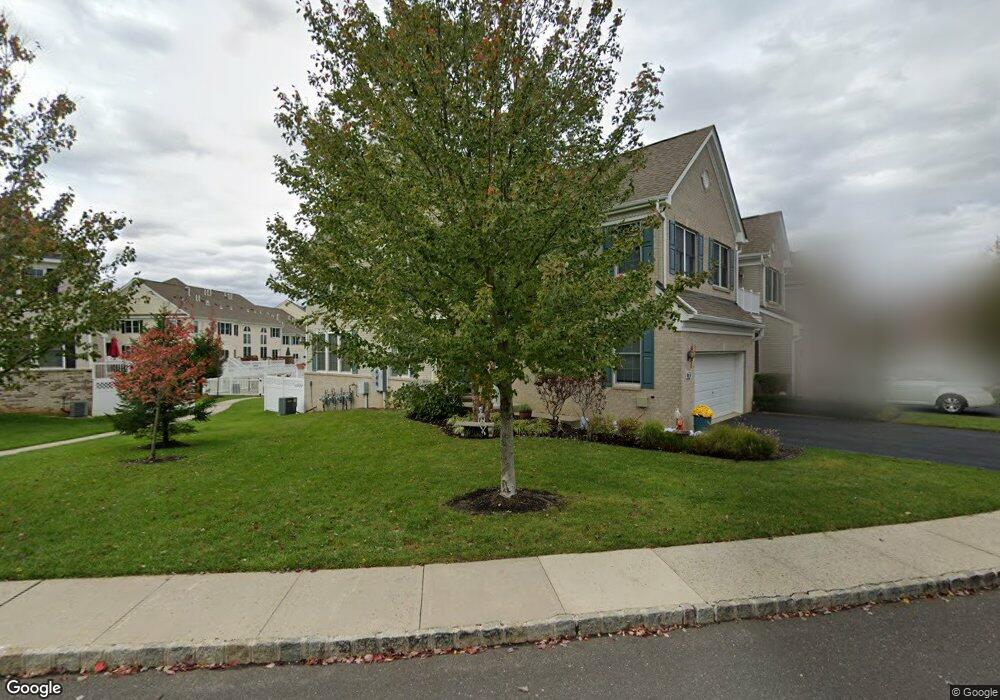
63 Demarest Dr Unit 1025A1 Manalapan, NJ 07726
Estimated Value: $794,000 - $824,000
4
Beds
2
Baths
2,191
Sq Ft
$367/Sq Ft
Est. Value
About This Home
This home is located at 63 Demarest Dr Unit 1025A1, Manalapan, NJ 07726 and is currently estimated at $804,499, approximately $367 per square foot. 63 Demarest Dr Unit 1025A1 is a home located in Monmouth County with nearby schools including Taylor Mills Elementary School, Manalapan-Englishtown Middle School, and Pine Brook Elementary School.
Ownership History
Date
Name
Owned For
Owner Type
Purchase Details
Closed on
Oct 4, 2024
Sold by
Patrizio Gerardo and Patrizio Maria
Bought by
Mayo Corbin Michael and Mayo Allison Lynn
Current Estimated Value
Home Financials for this Owner
Home Financials are based on the most recent Mortgage that was taken out on this home.
Original Mortgage
$581,250
Outstanding Balance
$574,869
Interest Rate
6.12%
Mortgage Type
New Conventional
Estimated Equity
$229,630
Purchase Details
Closed on
Mar 18, 2019
Sold by
Gable Glen and Gable Laurie
Bought by
Patrizio Gerardo and Patrizio Maria
Home Financials for this Owner
Home Financials are based on the most recent Mortgage that was taken out on this home.
Original Mortgage
$429,250
Interest Rate
6.87%
Mortgage Type
Adjustable Rate Mortgage/ARM
Create a Home Valuation Report for This Property
The Home Valuation Report is an in-depth analysis detailing your home's value as well as a comparison with similar homes in the area
Home Values in the Area
Average Home Value in this Area
Purchase History
| Date | Buyer | Sale Price | Title Company |
|---|---|---|---|
| Mayo Corbin Michael | $775,000 | Seber Title | |
| Patrizio Gerardo | $505,000 | Surety Title Company Llc |
Source: Public Records
Mortgage History
| Date | Status | Borrower | Loan Amount |
|---|---|---|---|
| Open | Mayo Corbin Michael | $581,250 | |
| Previous Owner | Patrizio Gerardo | $429,250 |
Source: Public Records
Tax History Compared to Growth
Tax History
| Year | Tax Paid | Tax Assessment Tax Assessment Total Assessment is a certain percentage of the fair market value that is determined by local assessors to be the total taxable value of land and additions on the property. | Land | Improvement |
|---|---|---|---|---|
| 2025 | $10,802 | $725,600 | $255,000 | $470,600 |
| 2024 | $10,459 | $639,900 | $170,000 | $469,900 |
| 2023 | $10,459 | $628,900 | $170,000 | $458,900 |
| 2022 | $10,462 | $594,900 | $153,000 | $441,900 |
| 2021 | $10,462 | $502,500 | $105,000 | $397,500 |
| 2020 | $10,292 | $499,600 | $100,000 | $399,600 |
| 2019 | $10,459 | $507,000 | $104,500 | $402,500 |
| 2018 | $10,158 | $489,300 | $104,500 | $384,800 |
| 2017 | $9,447 | $455,300 | $83,500 | $371,800 |
| 2016 | $9,216 | $448,700 | $80,000 | $368,700 |
| 2015 | $9,197 | $443,000 | $80,000 | $363,000 |
| 2014 | $8,739 | $410,300 | $80,000 | $330,300 |
Source: Public Records
Map
Nearby Homes
- 82 Demarest Dr Unit C1
- 40 Mulberry Dr
- 29 Bristol Rd
- 15 W Parsonage Way
- 12 Millhurst Rd
- 216 Deepwater Cir
- 13 Fells Dr Unit A1
- 40 Riva Ridge Rd
- 28 Shoemaker Rd
- 01 Private St
- 7 Pink Star Ct
- 24 Friesan Ct
- Ibiza Plan at K. Hovnanian's® Four Seasons at Manalapan Crossing
- Ibiza II Loft Plan at K. Hovnanian's® Four Seasons at Manalapan Crossing
- Palmera Plan at K. Hovnanian's® Four Seasons at Manalapan Crossing
- Dorchester Plan at K. Hovnanian's® Four Seasons at Manalapan Crossing
- Dorchester Loft Plan at K. Hovnanian's® Four Seasons at Manalapan Crossing
- Killarney II Plan at K. Hovnanian's® Four Seasons at Manalapan Crossing
- Killarney III Loft Plan at K. Hovnanian's® Four Seasons at Manalapan Crossing
- 193 Wintergreen Dr
- 65 Demarest Dr
- 67 Demarest Dr Unit 1025C1
- 69 Demarest Dr Unit D1
- 71 Demarest Dr
- 60 Demarest Dr Unit B1
- 62 Demarest Dr Unit A1
- 56 Demarest Dr Unit D1
- 58 Demarest Dr Unit C1
- 47 Demarest Dr Unit 26D
- 66 Demarest Dr Unit F1
- 54 Demarest Dr Unit E1
- 45 Demarest Dr Unit C1
- 68 Demarest Dr Unit E1
- 72 Demarest Dr Unit C1
- 70 Demarest Dr Unit D1
- 43 Demarest Dr Unit 26B
- 87 Demarest Dr Unit 24A
- 74 Demarest Dr Unit B1
- 41 Demarest Dr Unit A1
- 76 Demarest Dr Unit 1003A1