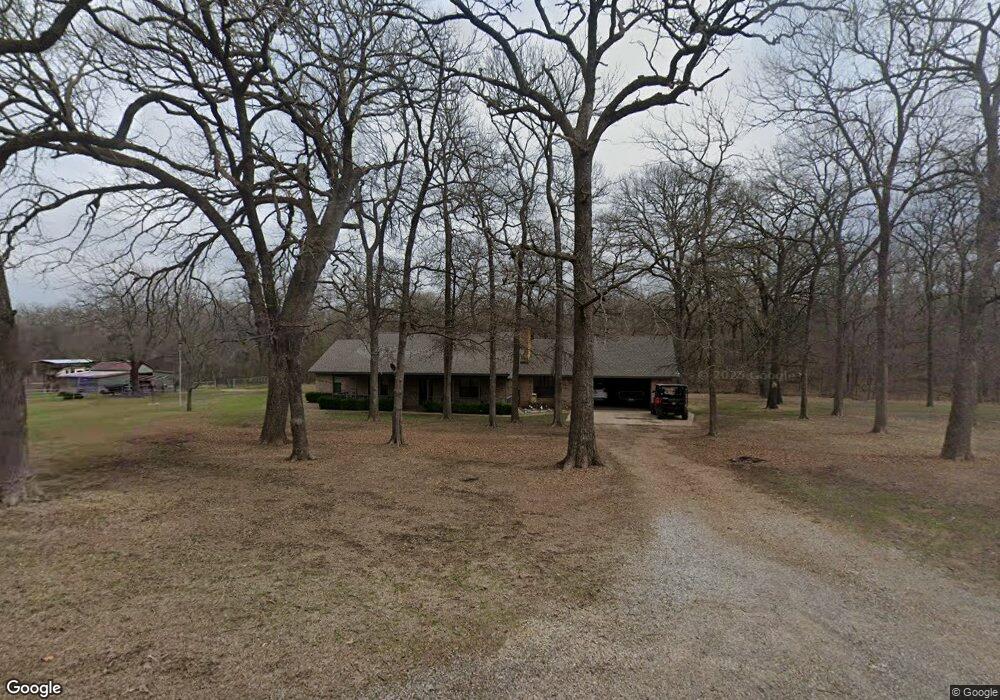
63 Diana Dr Denison, TX 75021
Estimated Value: $373,542 - $524,000
--
Bed
--
Bath
1,827
Sq Ft
$246/Sq Ft
Est. Value
About This Home
This home is located at 63 Diana Dr, Denison, TX 75021 and is currently estimated at $448,771, approximately $245 per square foot. 63 Diana Dr is a home with nearby schools including Bells Elementary School, Pritchard Junior High School, and Bells High School.
Ownership History
Date
Name
Owned For
Owner Type
Purchase Details
Closed on
Oct 15, 2025
Sold by
Wornhor Peter Xaver
Bought by
Wornhor Peter Xaver and Wornhor Peter Lyn
Current Estimated Value
Purchase Details
Closed on
Jan 13, 2022
Sold by
Wornhor Peter X and Wornhor Shirlene
Bought by
Wornhor Peter Lyn
Create a Home Valuation Report for This Property
The Home Valuation Report is an in-depth analysis detailing your home's value as well as a comparison with similar homes in the area
Home Values in the Area
Average Home Value in this Area
Purchase History
| Date | Buyer | Sale Price | Title Company |
|---|---|---|---|
| Wornhor Peter Xaver | -- | None Listed On Document | |
| Wornhor Peter Lyn | -- | None Listed On Document |
Source: Public Records
Tax History Compared to Growth
Tax History
| Year | Tax Paid | Tax Assessment Tax Assessment Total Assessment is a certain percentage of the fair market value that is determined by local assessors to be the total taxable value of land and additions on the property. | Land | Improvement |
|---|---|---|---|---|
| 2025 | $999 | $293,610 | $38,871 | $254,739 |
| 2024 | $4,650 | $292,274 | $0 | $0 |
| 2023 | $1,006 | $355,799 | $0 | $0 |
| 2022 | $5,545 | $323,454 | $0 | $0 |
| 2021 | $5,564 | $312,179 | $91,200 | $220,979 |
| 2020 | $5,285 | $275,063 | $94,400 | $180,663 |
| 2019 | $5,175 | $263,014 | $89,600 | $173,414 |
| 2018 | $4,700 | $222,433 | $76,800 | $145,633 |
| 2017 | $4,300 | $214,327 | $67,434 | $146,893 |
| 2016 | $3,757 | $182,581 | $51,792 | $130,789 |
| 2015 | $0 | $168,396 | $56,909 | $111,487 |
| 2014 | -- | $157,996 | $46,509 | $111,487 |
Source: Public Records
Map
Nearby Homes
- 263 Esquire Dr
- 10 Ac Fm 1753 Hwy
- 131 Dugan Chapel Rd
- TBD Dugan Chapel Rd
- TBD Lil Arkansas Rd
- 0 Tbd2 Fleming Rd
- 0 Fleming Rd
- 0 Tbd Dugan Chapel Rd
- 6091 Fm 1753
- 5994 Fm 1753
- 6294 Dugan Chapel Rd
- 2760 Fm 1897
- 469 Dugan Chapel Rd
- 598 Stagecoach Trail
- 40 acres Neq of Hwy 69 and Hwy 82 Hwy
- 9015 N Us Highway 69
- TBD Shaffer Rd
- 4822 Fm 1753
- TBD Neq of Hwy 69 and Hwy 82 H Hwy Unit Lot 9
- TBD Neq of Hwy 69 and Hwy 82 Hwy Unit Lot 13