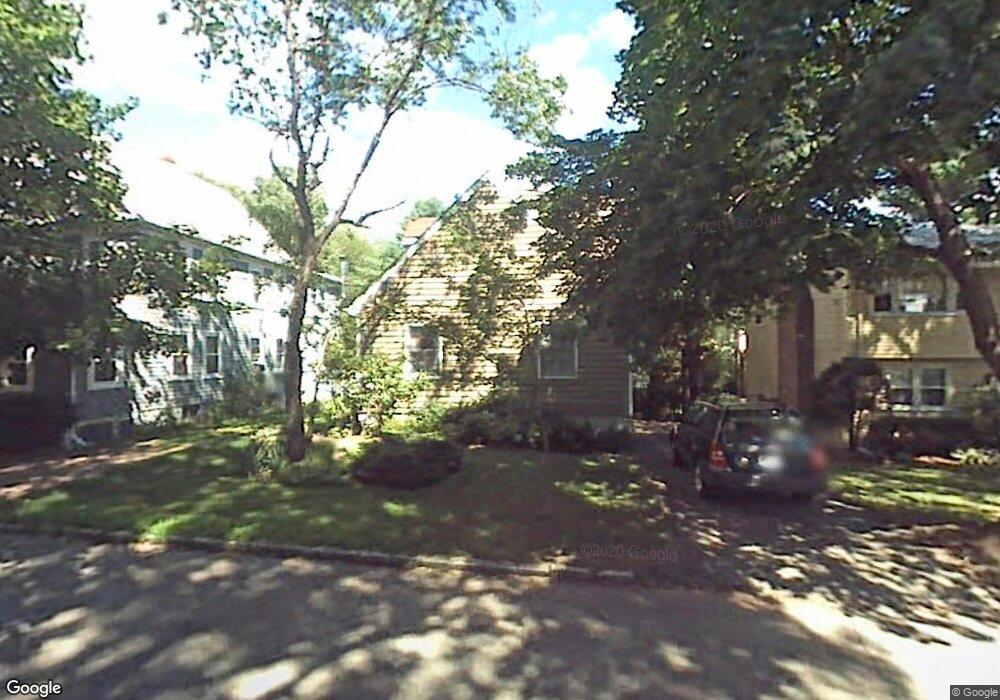
63 Dothan St Arlington, MA 02474
Arlington Heights NeighborhoodEstimated Value: $845,000 - $1,261,000
3
Beds
2
Baths
1,575
Sq Ft
$702/Sq Ft
Est. Value
About This Home
This home is located at 63 Dothan St, Arlington, MA 02474 and is currently estimated at $1,105,061, approximately $701 per square foot. 63 Dothan St is a home located in Middlesex County with nearby schools including Peirce Elementary School, M. Norcross Stratton Elementary School, and Ottoson Middle School.
Ownership History
Date
Name
Owned For
Owner Type
Purchase Details
Closed on
Jul 9, 2020
Sold by
Hickman John W and Berezin Lisa
Bought by
Lisa Berezin T and Lisa Berezin
Current Estimated Value
Purchase Details
Closed on
Feb 1, 1989
Sold by
Sonnenberg Ann M
Bought by
Hickman John W
Create a Home Valuation Report for This Property
The Home Valuation Report is an in-depth analysis detailing your home's value as well as a comparison with similar homes in the area
Home Values in the Area
Average Home Value in this Area
Purchase History
| Date | Buyer | Sale Price | Title Company |
|---|---|---|---|
| Lisa Berezin T | -- | None Available | |
| Hickman John W | $200,000 | -- |
Source: Public Records
Mortgage History
| Date | Status | Borrower | Loan Amount |
|---|---|---|---|
| Previous Owner | Hickman John W | $107,000 | |
| Previous Owner | Hickman John W | $129,000 | |
| Previous Owner | Hickman John W | $130,000 |
Source: Public Records
Tax History
| Year | Tax Paid | Tax Assessment Tax Assessment Total Assessment is a certain percentage of the fair market value that is determined by local assessors to be the total taxable value of land and additions on the property. | Land | Improvement |
|---|---|---|---|---|
| 2025 | $9,423 | $874,900 | $426,000 | $448,900 |
| 2024 | $8,657 | $817,500 | $410,000 | $407,500 |
| 2023 | $8,173 | $729,100 | $383,400 | $345,700 |
| 2022 | $8,026 | $702,800 | $372,700 | $330,100 |
| 2021 | $7,843 | $691,600 | $372,700 | $318,900 |
| 2020 | $7,649 | $691,600 | $372,700 | $318,900 |
| 2019 | $6,998 | $621,500 | $367,400 | $254,100 |
| 2018 | $6,505 | $536,300 | $282,200 | $254,100 |
| 2017 | $6,535 | $520,300 | $266,200 | $254,100 |
| 2016 | $6,387 | $499,000 | $244,900 | $254,100 |
| 2015 | $5,938 | $438,200 | $228,900 | $209,300 |
Source: Public Records
Map
Nearby Homes
- 12 Elwern Rd
- 11 Lorraine Terrace
- 0 Reed St
- 337 Washington St
- 58 Alpine St
- 10 Viking Rd
- 37 Mayflower Rd
- 67 Lowell St
- 69 Edmund Rd
- 17 Oakledge St
- 30 Whipple Rd
- 181 Lowell St
- 92 Overlook Rd
- 97 Bow St
- 455-457 Summer St
- 455 Summer St Unit 455
- 7 Park Avenue Extension
- 7 Whipple Rd
- 4 Beck Rd
- 15 Mayflower Rd
Your Personal Tour Guide
Ask me questions while you tour the home.