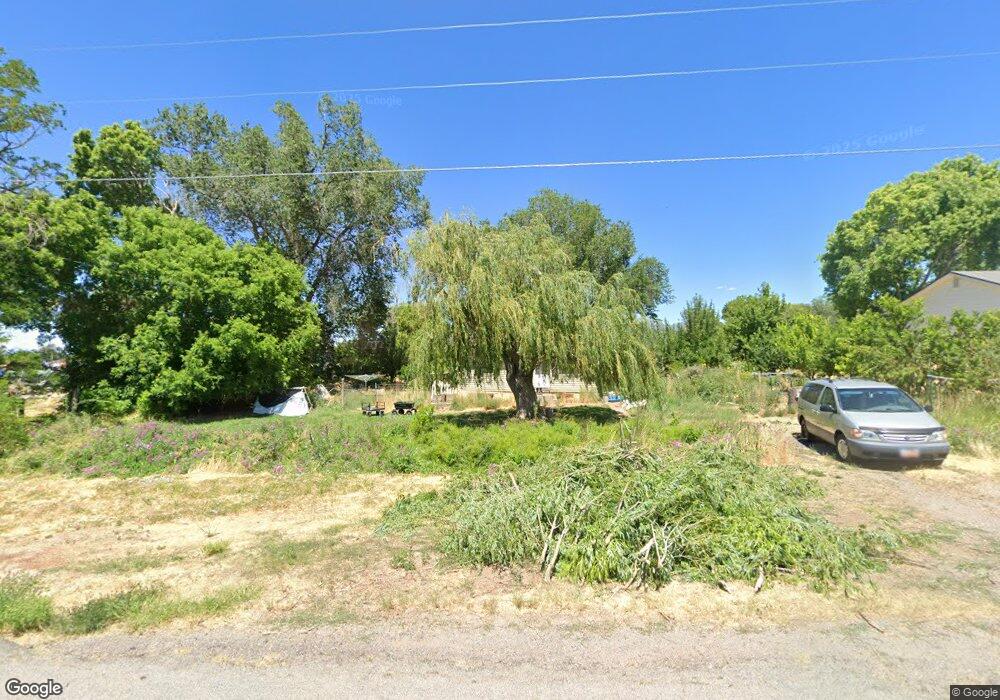
63 E 200 S Holden, UT 84636
Estimated Value: $281,000 - $482,000
2
Beds
1
Bath
912
Sq Ft
$426/Sq Ft
Est. Value
About This Home
This home is located at 63 E 200 S, Holden, UT 84636 and is currently estimated at $388,333, approximately $425 per square foot. 63 E 200 S is a home located in Millard County.
Ownership History
Date
Name
Owned For
Owner Type
Purchase Details
Closed on
Mar 7, 2018
Sold by
Josse Denise A
Bought by
Skabelund Andrew Grant and Skabelund Rebecca Nelson
Current Estimated Value
Purchase Details
Closed on
Feb 10, 2010
Sold by
Josse Denise Ann
Bought by
Josse Denise A
Home Financials for this Owner
Home Financials are based on the most recent Mortgage that was taken out on this home.
Original Mortgage
$46,920
Interest Rate
5.03%
Mortgage Type
New Conventional
Create a Home Valuation Report for This Property
The Home Valuation Report is an in-depth analysis detailing your home's value as well as a comparison with similar homes in the area
Purchase History
| Date | Buyer | Sale Price | Title Company |
|---|---|---|---|
| Skabelund Andrew Grant | -- | -- | |
| Josse Denise A | -- | -- | |
| Josse Denise A | -- | -- |
Source: Public Records
Mortgage History
| Date | Status | Borrower | Loan Amount |
|---|---|---|---|
| Previous Owner | Josse Denise A | $46,920 |
Source: Public Records
Tax History
| Year | Tax Paid | Tax Assessment Tax Assessment Total Assessment is a certain percentage of the fair market value that is determined by local assessors to be the total taxable value of land and additions on the property. | Land | Improvement |
|---|---|---|---|---|
| 2025 | $472 | $60,716 | $11,857 | $48,859 |
| 2024 | $472 | $57,766 | $11,523 | $46,243 |
| 2023 | $651 | $57,766 | $11,523 | $46,243 |
| 2022 | $498 | $46,109 | $9,602 | $36,507 |
| 2021 | $406 | $35,870 | $8,001 | $27,869 |
| 2020 | $344 | $30,563 | $6,958 | $23,605 |
| 2019 | $335 | $29,930 | $6,325 | $23,605 |
| 2018 | $270 | $24,606 | $5,500 | $19,106 |
| 2017 | $268 | $23,356 | $5,500 | $17,856 |
| 2016 | $232 | $20,981 | $5,500 | $15,481 |
| 2015 | $232 | $20,981 | $5,500 | $15,481 |
| 2014 | -- | $20,981 | $5,500 | $15,481 |
| 2013 | -- | $20,981 | $5,500 | $15,481 |
Source: Public Records
Map
Nearby Homes
- 164 W 200 North Rd
- 600 E 1200 St N
- 3700 W 5800 N
- 205 N 100 E
- 2155 N Cedar Mountain Rd
- 2835 N Cedar Mountain Rd
- 390 N 100 W
- 335 W 400 North St
- 410 W 400 N
- 245 W 300 N
- 225 W 200 St N
- 75 N 100 West St
- 400 W 2600 North St
- 40 S 100 Rd E
- 155 W Center St
- 430 E Canyon Rd
- 235 S 200 St E
- 220 S 200 E
- 351 W 100 South St
- 750 800 South Fillmore
Your Personal Tour Guide
Ask me questions while you tour the home.