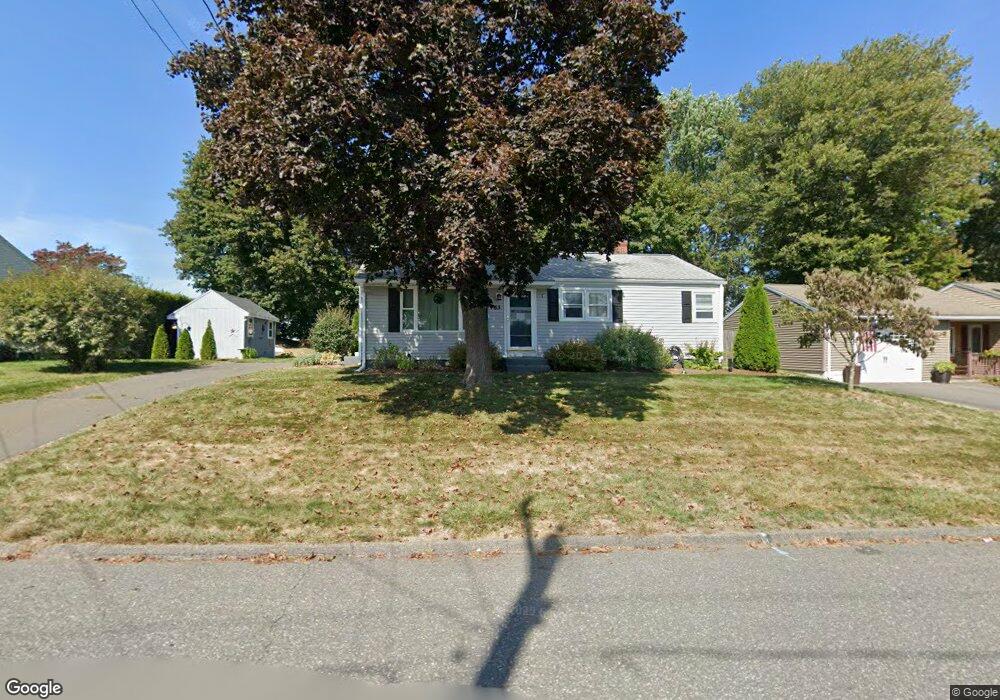
63 Edbert Dr Holyoke, MA 01040
Estimated Value: $278,000 - $321,000
3
Beds
1
Bath
960
Sq Ft
$317/Sq Ft
Est. Value
About This Home
This home is located at 63 Edbert Dr, Holyoke, MA 01040 and is currently estimated at $304,671, approximately $317 per square foot. 63 Edbert Dr is a home located in Hampden County with nearby schools including Lt. Elmer J. McMahon Elementary School, Lt. Clayre Sullivan Elementary School, and Holyoke High School.
Ownership History
Date
Name
Owned For
Owner Type
Purchase Details
Closed on
Aug 30, 2016
Sold by
Dagata Amy B
Bought by
Gazda Paul A and Gazda Jennifer L
Current Estimated Value
Home Financials for this Owner
Home Financials are based on the most recent Mortgage that was taken out on this home.
Original Mortgage
$176,739
Outstanding Balance
$140,899
Interest Rate
3.37%
Mortgage Type
FHA
Estimated Equity
$163,772
Purchase Details
Closed on
Oct 28, 2005
Sold by
Stawarz Raymond F
Bought by
Magri Amy B
Home Financials for this Owner
Home Financials are based on the most recent Mortgage that was taken out on this home.
Original Mortgage
$165,900
Interest Rate
5.79%
Mortgage Type
Purchase Money Mortgage
Create a Home Valuation Report for This Property
The Home Valuation Report is an in-depth analysis detailing your home's value as well as a comparison with similar homes in the area
Home Values in the Area
Average Home Value in this Area
Purchase History
| Date | Buyer | Sale Price | Title Company |
|---|---|---|---|
| Gazda Paul A | $180,000 | -- | |
| Magri Amy B | $165,900 | -- |
Source: Public Records
Mortgage History
| Date | Status | Borrower | Loan Amount |
|---|---|---|---|
| Open | Gazda Paul A | $176,739 | |
| Previous Owner | Magri Amy B | $165,900 |
Source: Public Records
Tax History
| Year | Tax Paid | Tax Assessment Tax Assessment Total Assessment is a certain percentage of the fair market value that is determined by local assessors to be the total taxable value of land and additions on the property. | Land | Improvement |
|---|---|---|---|---|
| 2025 | $4,087 | $234,100 | $62,600 | $171,500 |
| 2024 | $3,839 | $202,600 | $59,600 | $143,000 |
| 2023 | $3,683 | $196,300 | $59,600 | $136,700 |
| 2022 | $3,563 | $185,000 | $59,600 | $125,400 |
| 2021 | $3,388 | $175,800 | $57,000 | $118,800 |
| 2020 | $3,188 | $167,100 | $57,000 | $110,100 |
| 2019 | $3,079 | $159,600 | $57,000 | $102,600 |
| 2018 | $2,950 | $154,200 | $57,000 | $97,200 |
| 2017 | $2,956 | $154,200 | $57,000 | $97,200 |
| 2016 | $2,600 | $136,000 | $58,900 | $77,100 |
| 2015 | $2,589 | $136,000 | $58,900 | $77,100 |
Source: Public Records
Map
Nearby Homes
- 147 Sheehan Dr
- 350 Homestead Ave
- 337 Westfield Rd
- 286 Westfield Rd
- 94 Vermont St
- 15 Maple Crest Cir Unit D
- 25-27 Elmwood Ave
- 53 Farnum Dr Unit 53
- 2027-2029 Northampton St
- 10 View St
- 133-135 Brown Ave
- 958 Main St
- 934 Main St
- 60 Chapin St Unit D
- 69 Gates St
- 26 Vernon St
- 287 Whitney Ave
- 1705-1707 Northampton St
- 1684 Northampton St
- 21 Francis Ave
Your Personal Tour Guide
Ask me questions while you tour the home.