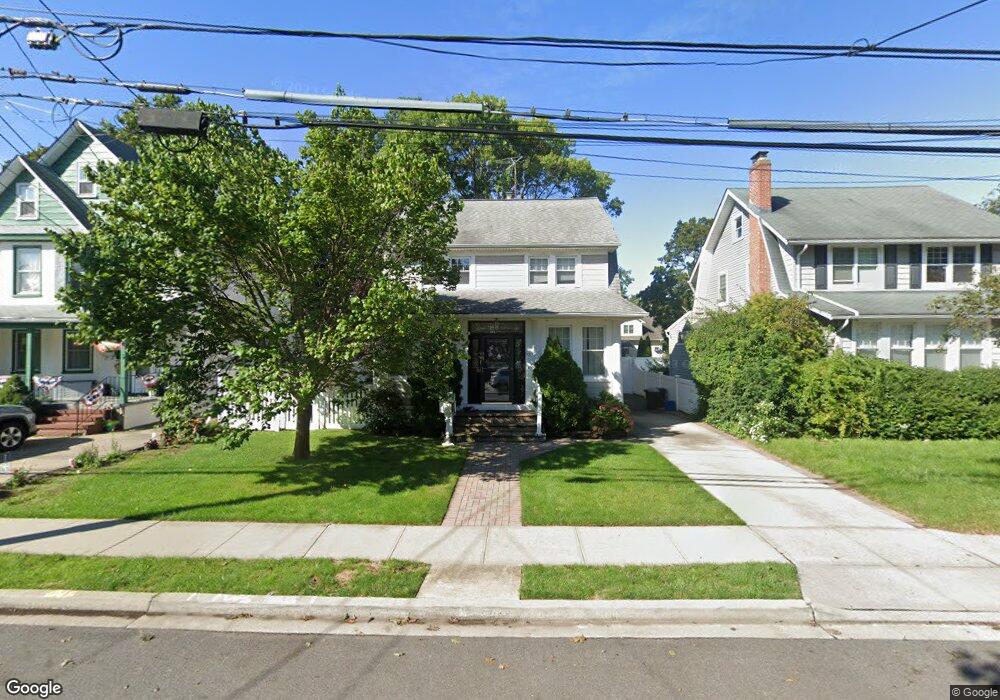
63 Edmund St Lynbrook, NY 11563
Estimated Value: $784,513 - $785,000
4
Beds
2
Baths
1,609
Sq Ft
$488/Sq Ft
Est. Value
About This Home
This home is located at 63 Edmund St, Lynbrook, NY 11563 and is currently estimated at $784,757, approximately $487 per square foot. 63 Edmund St is a home located in Nassau County with nearby schools including Davison Avenue Intermediate School, Maurice W. Downing Primary K-2 School, and Howard T Herber Middle School.
Ownership History
Date
Name
Owned For
Owner Type
Purchase Details
Closed on
Sep 3, 2014
Sold by
Bender Brian F and Bender Eileen Speck
Bought by
Frulio Ciro and Fruilio Kendall
Current Estimated Value
Home Financials for this Owner
Home Financials are based on the most recent Mortgage that was taken out on this home.
Original Mortgage
$374,000
Outstanding Balance
$286,110
Interest Rate
4.12%
Mortgage Type
Purchase Money Mortgage
Estimated Equity
$498,647
Purchase Details
Closed on
Jan 9, 1997
Sold by
Ogrady Martin F and Ogrady Nancy J
Bought by
Benter Brian F and Benter Eileen S
Purchase Details
Closed on
Aug 22, 1995
Sold by
Strong Priscilla Est
Bought by
Ogrady Martin and Duncan Nancy
Home Financials for this Owner
Home Financials are based on the most recent Mortgage that was taken out on this home.
Original Mortgage
$122,000
Interest Rate
7.81%
Create a Home Valuation Report for This Property
The Home Valuation Report is an in-depth analysis detailing your home's value as well as a comparison with similar homes in the area
Home Values in the Area
Average Home Value in this Area
Purchase History
| Date | Buyer | Sale Price | Title Company |
|---|---|---|---|
| Frulio Ciro | $440,000 | Judical Title | |
| Benter Brian F | $162,500 | -- | |
| Ogrady Martin | $152,500 | -- |
Source: Public Records
Mortgage History
| Date | Status | Borrower | Loan Amount |
|---|---|---|---|
| Open | Frulio Ciro | $374,000 | |
| Previous Owner | Ogrady Martin | $122,000 |
Source: Public Records
Tax History Compared to Growth
Tax History
| Year | Tax Paid | Tax Assessment Tax Assessment Total Assessment is a certain percentage of the fair market value that is determined by local assessors to be the total taxable value of land and additions on the property. | Land | Improvement |
|---|---|---|---|---|
| 2025 | $10,693 | $491 | $205 | $286 |
| 2024 | $1,058 | $491 | $205 | $286 |
| 2023 | $8,905 | $519 | $217 | $302 |
| 2022 | $8,905 | $491 | $205 | $286 |
| 2021 | $11,469 | $490 | $205 | $285 |
| 2020 | $8,137 | $589 | $473 | $116 |
| 2019 | $7,328 | $632 | $372 | $260 |
| 2018 | $7,322 | $862 | $0 | $0 |
| 2017 | $7,922 | $839 | $508 | $331 |
| 2016 | $9,135 | $839 | $508 | $331 |
| 2015 | -- | $839 | $508 | $331 |
| 2014 | -- | $839 | $508 | $331 |
| 2013 | $1,143 | $839 | $508 | $331 |
Source: Public Records
Map
Nearby Homes