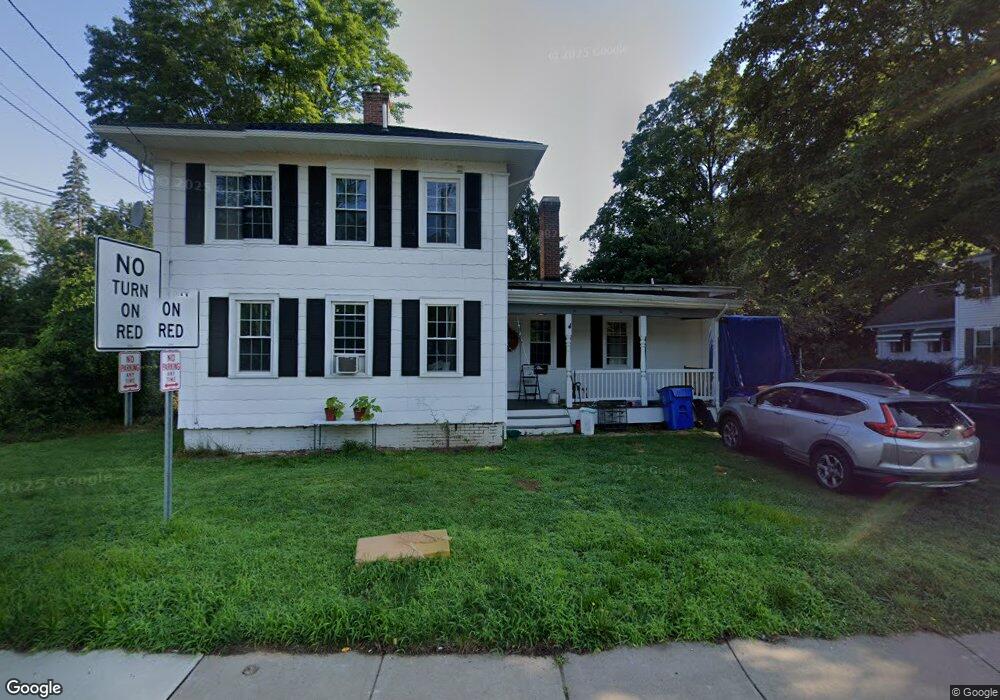
63 Elm St Unit 63B Windsor Locks, CT 06096
Estimated Value: $310,000 - $359,000
2
Beds
1
Bath
1,638
Sq Ft
$204/Sq Ft
Est. Value
About This Home
This home is located at 63 Elm St Unit 63B, Windsor Locks, CT 06096 and is currently estimated at $334,591, approximately $204 per square foot. 63 Elm St Unit 63B is a home located in Hartford County with nearby schools including North Street School, South Elementary School, and Windsor Locks Middle School.
Ownership History
Date
Name
Owned For
Owner Type
Purchase Details
Closed on
Mar 3, 2023
Sold by
Savino Phillip
Bought by
Bermudez Delixandra
Current Estimated Value
Home Financials for this Owner
Home Financials are based on the most recent Mortgage that was taken out on this home.
Original Mortgage
$279,837
Outstanding Balance
$270,735
Interest Rate
6.13%
Mortgage Type
FHA
Estimated Equity
$63,856
Purchase Details
Closed on
Jan 19, 2006
Sold by
Schroeder Eric
Bought by
Savino Philip
Home Financials for this Owner
Home Financials are based on the most recent Mortgage that was taken out on this home.
Original Mortgage
$150,000
Interest Rate
6.33%
Purchase Details
Closed on
Feb 27, 2002
Sold by
Beaupre Frances and Beaupre George
Bought by
Schroeder Eric
Purchase Details
Closed on
Jun 30, 2000
Sold by
Steen Barbara
Bought by
Beaugre George and Beaugre Frances
Create a Home Valuation Report for This Property
The Home Valuation Report is an in-depth analysis detailing your home's value as well as a comparison with similar homes in the area
Home Values in the Area
Average Home Value in this Area
Purchase History
| Date | Buyer | Sale Price | Title Company |
|---|---|---|---|
| Bermudez Delixandra | $285,000 | None Available | |
| Savino Philip | $188,000 | -- | |
| Schroeder Eric | $122,000 | -- | |
| Beaugre George | $99,000 | -- |
Source: Public Records
Mortgage History
| Date | Status | Borrower | Loan Amount |
|---|---|---|---|
| Open | Bermudez Delixandra | $279,837 | |
| Previous Owner | Beaugre George | $150,000 | |
| Previous Owner | Beaugre George | $37,600 | |
| Previous Owner | Beaugre George | $160,000 |
Source: Public Records
Tax History
| Year | Tax Paid | Tax Assessment Tax Assessment Total Assessment is a certain percentage of the fair market value that is determined by local assessors to be the total taxable value of land and additions on the property. | Land | Improvement |
|---|---|---|---|---|
| 2025 | $4,202 | $175,140 | $47,460 | $127,680 |
| 2024 | $3,892 | $138,320 | $38,010 | $100,310 |
| 2023 | $3,642 | $138,320 | $38,010 | $100,310 |
| 2022 | $2,799 | $108,360 | $38,010 | $70,350 |
| 2021 | $3,142 | $121,660 | $38,010 | $83,650 |
| 2020 | $3,115 | $120,610 | $38,010 | $82,600 |
| 2019 | $3,074 | $119,000 | $38,010 | $80,990 |
| 2017 | $2,711 | $101,700 | $36,900 | $64,800 |
| 2016 | $2,711 | $101,700 | $36,900 | $64,800 |
| 2015 | $2,725 | $101,700 | $36,900 | $64,800 |
| 2014 | $3,098 | $118,100 | $41,900 | $76,200 |
Source: Public Records
Map
Nearby Homes
- 59 Elm St
- 102 Orchard Hill Dr
- 202 Reed Ave
- 140 S Water St
- 19 Dean Ave
- 13 Jubrey Ln
- 80 West St
- 24 Coolidge St
- 15 Suffield St
- 0 N Water St Unit 24138494
- 0 N Water St Unit 24128295
- 0 N Water St Unit 24128294
- 0 N Water St Unit 24128288
- 0 N Water St
- 24 Bel-Aire Cir
- 13 Quail Ct
- 143 Bridge St
- 4 Woodland Hollow St
- 404 Woodland St
- 241 S Water St Unit 14
- 63 Elm St Unit B
- 63 Elm St Unit A
- 63 Elm St
- 59 Elm St Unit B
- 59 Elm St Unit A
- 59 Elm St
- 56 Elm St Unit 56-B
- 56 Elm St Unit B
- 56 Elm St Unit A
- 56 Elm St
- 57 Elm St Unit B
- 57 Elm St Unit A
- 57 Elm St Unit 57B
- 1 Center St
- 2 S Center St
- 2 S Center St Unit 56 Elm
- 57 Elm St
- 52 Elm St Unit B
- 52 Elm St Unit A
- 52 Elm St
Your Personal Tour Guide
Ask me questions while you tour the home.