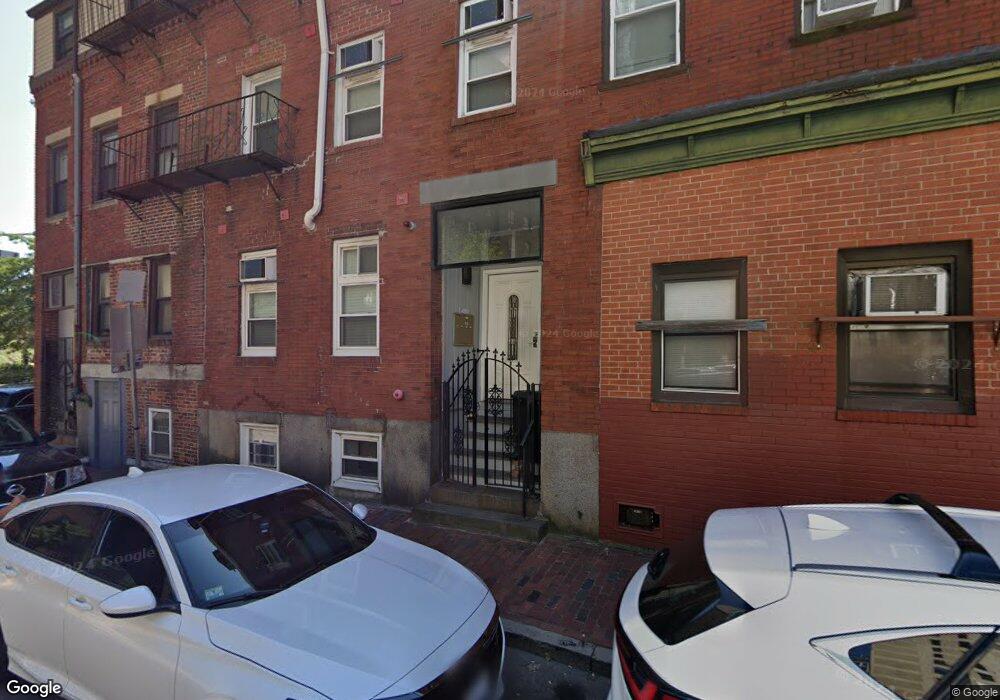
63 Harvard St Boston, MA 02111
Chinatown NeighborhoodEstimated Value: $1,619,000 - $2,597,404
5
Beds
3
Baths
1,790
Sq Ft
$1,072/Sq Ft
Est. Value
About This Home
This home is located at 63 Harvard St, Boston, MA 02111 and is currently estimated at $1,918,851, approximately $1,071 per square foot. 63 Harvard St is a home located in Suffolk County with nearby schools including Park Street School, St John School, and Cathedral High School.
Ownership History
Date
Name
Owned For
Owner Type
Purchase Details
Closed on
Sep 10, 2019
Sold by
Q Chinatown Realtor Llc
Bought by
Gu Billy
Current Estimated Value
Purchase Details
Closed on
Mar 2, 2017
Sold by
Chen Yung M and Chen Shu F
Bought by
Q Chinatown Realtor Ll
Purchase Details
Closed on
Feb 3, 2017
Sold by
Chen Yung M and Seto Toby
Bought by
Seto Toby K and Chen Sherry H
Purchase Details
Closed on
Oct 31, 2012
Sold by
Choy Yiu Est
Bought by
Chen Yung M and Seto Toby K
Home Financials for this Owner
Home Financials are based on the most recent Mortgage that was taken out on this home.
Original Mortgage
$438,700
Interest Rate
3.5%
Mortgage Type
New Conventional
Create a Home Valuation Report for This Property
The Home Valuation Report is an in-depth analysis detailing your home's value as well as a comparison with similar homes in the area
Home Values in the Area
Average Home Value in this Area
Purchase History
| Date | Buyer | Sale Price | Title Company |
|---|---|---|---|
| Gu Billy | -- | -- | |
| Q Chinatown Realtor Ll | $1,470,000 | -- | |
| Seto Toby K | -- | -- | |
| Chen Yung M | $585,000 | -- |
Source: Public Records
Mortgage History
| Date | Status | Borrower | Loan Amount |
|---|---|---|---|
| Previous Owner | Chen Yung M | $438,700 |
Source: Public Records
Tax History Compared to Growth
Tax History
| Year | Tax Paid | Tax Assessment Tax Assessment Total Assessment is a certain percentage of the fair market value that is determined by local assessors to be the total taxable value of land and additions on the property. | Land | Improvement |
|---|---|---|---|---|
| 2025 | $13,470 | $1,163,200 | $331,300 | $831,900 |
| 2024 | $11,602 | $1,064,400 | $426,800 | $637,600 |
| 2023 | $11,432 | $1,064,400 | $426,800 | $637,600 |
| 2022 | $11,238 | $1,032,900 | $414,200 | $618,700 |
| 2021 | $10,496 | $983,700 | $394,500 | $589,200 |
| 2020 | $8,902 | $843,000 | $388,800 | $454,200 |
| 2019 | $8,306 | $788,000 | $302,100 | $485,900 |
| 2018 | $7,611 | $726,200 | $302,100 | $424,100 |
| 2017 | $7,322 | $691,400 | $302,100 | $389,300 |
| 2016 | $7,107 | $646,100 | $302,100 | $344,000 |
| 2015 | $3,484 | $287,705 | $133,980 | $153,725 |
| 2014 | $4,765 | $378,800 | $243,600 | $135,200 |
Source: Public Records
Map
Nearby Homes
- 1 Nassau St Unit 1607
- 1 Nassau St Unit 1605
- 1 Nassau St Unit 1205
- 1 Nassau St Unit 1102
- 1 Nassau St Unit 1103
- 42 Beach St Unit 9D
- 111 Beach St Unit 1F
- 111 Beach St Unit 5C
- 121-123 Beach St Unit 801
- 55 Lagrange St Unit 1703
- 55 Lagrange St Unit 1802
- 55 Lagrange St Unit 1507
- 55 Lagrange St Unit 1404
- 55 Lagrange St Unit 1203
- 55 Lagrange St Unit 2004
- 55 Lagrange St Unit 1504
- 55 Lagrange St Unit 1904
- 55 Lagrange St Unit 903
- 55 Lagrange St Unit 1010
- 55 Lagrange St Unit 1102
- 65 Harvard St Unit 65A
- 71 Hudson St Unit 71A
- 76 Tyler St Unit E
- 76 Tyler St Unit D
- 76 Tyler St Unit C
- 76 Tyler St Unit B
- 76 Tyler St Unit A
- 76 Tyler St Unit P4
- 76 Tyler St Unit J
- 76 Tyler St Unit B2
- 76 Tyler St Unit 3rd
- 76 Tyler St Unit N
- 76 Tyler St Unit 8
- 76 Tyler St
- 76 Tyler St Unit 1
- 73 Hudson St Unit 1
- 75 Hudson St
- 60 Harvard St
- 57 Harvard St Unit 57A
- 77 Hudson St Unit 77A