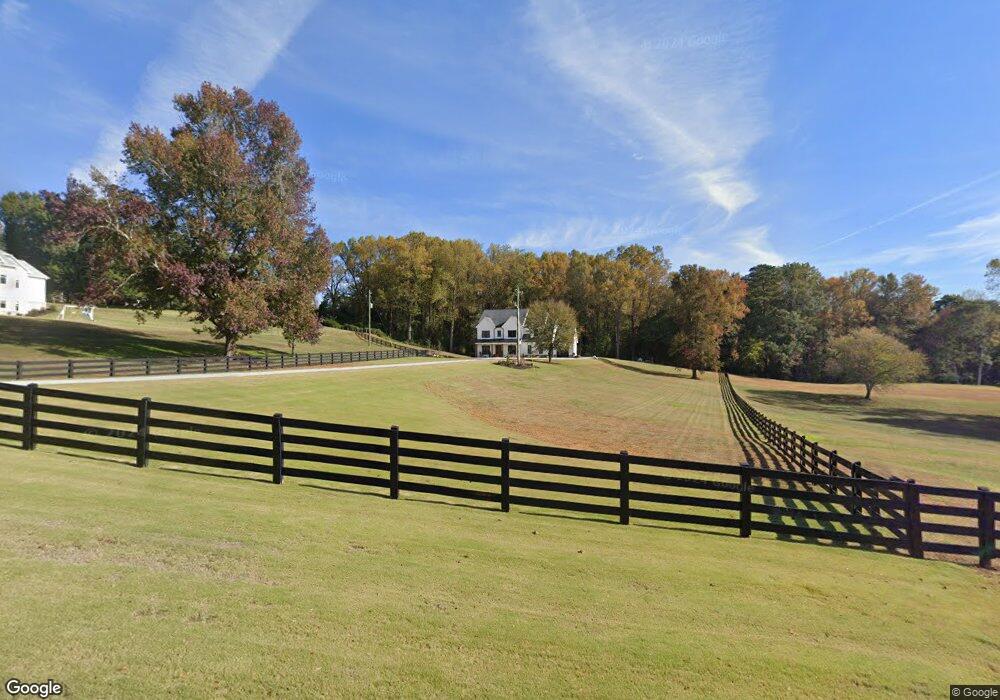
63 Hensley Ln Hoschton, GA 30548
Estimated Value: $623,080 - $873,000
--
Bed
1
Bath
3,512
Sq Ft
$204/Sq Ft
Est. Value
About This Home
This home is located at 63 Hensley Ln, Hoschton, GA 30548 and is currently estimated at $716,770, approximately $204 per square foot. 63 Hensley Ln is a home with nearby schools including Gum Springs Elementary School, West Jackson Middle School, and Jackson County High School.
Ownership History
Date
Name
Owned For
Owner Type
Purchase Details
Closed on
Jul 7, 2022
Sold by
Starkon Homes Llc
Bought by
Vazemiller Alexander and Vazemiller Anita
Current Estimated Value
Home Financials for this Owner
Home Financials are based on the most recent Mortgage that was taken out on this home.
Original Mortgage
$375,000
Outstanding Balance
$356,690
Interest Rate
5.23%
Mortgage Type
New Conventional
Estimated Equity
$360,080
Purchase Details
Closed on
Dec 30, 2021
Sold by
Starkon Homes Llc
Bought by
Glushchak Tatyana
Purchase Details
Closed on
Dec 15, 2020
Sold by
Hensley Elizabeth
Bought by
Starkon Homes Llc
Purchase Details
Closed on
Oct 2, 2020
Sold by
Hensley Kenneth Jerome Estate
Bought by
Hensley Elizabeth Bradbury
Purchase Details
Closed on
Dec 29, 2015
Sold by
Hensley Elizabeth
Bought by
Hensley Kenneth
Purchase Details
Closed on
Aug 12, 2013
Sold by
Evans Reece Andrew /Tr
Bought by
Hensley Kenneth and Hensley Elizabeth
Purchase Details
Closed on
Sep 14, 2004
Sold by
Evans Reece Andrew
Bought by
Evans Reece Andrew
Create a Home Valuation Report for This Property
The Home Valuation Report is an in-depth analysis detailing your home's value as well as a comparison with similar homes in the area
Home Values in the Area
Average Home Value in this Area
Purchase History
| Date | Buyer | Sale Price | Title Company |
|---|---|---|---|
| Vazemiller Alexander | $550,000 | -- | |
| Vazemiller Alexander | $550,000 | -- | |
| Glushchak Tatyana | $300,000 | -- | |
| Starkon Homes Llc | $880,017 | -- | |
| Hensley Elizabeth Bradbury | -- | -- | |
| Hensley Kenneth | -- | -- | |
| Hensley Kenneth | $229,923 | -- | |
| Evans Reece Andrew | -- | -- |
Source: Public Records
Mortgage History
| Date | Status | Borrower | Loan Amount |
|---|---|---|---|
| Open | Vazemiller Alexander | $375,000 | |
| Closed | Vazemiller Alexander | $375,000 |
Source: Public Records
Tax History Compared to Growth
Tax History
| Year | Tax Paid | Tax Assessment Tax Assessment Total Assessment is a certain percentage of the fair market value that is determined by local assessors to be the total taxable value of land and additions on the property. | Land | Improvement |
|---|---|---|---|---|
| 2024 | $6,477 | $268,720 | $32,160 | $236,560 |
| 2023 | $6,477 | $257,040 | $32,160 | $224,880 |
| 2022 | $447 | $16,080 | $16,080 | $0 |
| 2021 | $2,950 | $105,440 | $105,440 | $0 |
| 2020 | $545 | $105,440 | $105,440 | $0 |
| 2019 | $523 | $105,440 | $105,440 | $0 |
| 2018 | $515 | $105,440 | $105,440 | $0 |
| 2017 | $505 | $94,898 | $94,898 | $0 |
| 2016 | $493 | $94,898 | $94,898 | $0 |
| 2015 | $481 | $93,727 | $93,727 | $0 |
| 2014 | $471 | $93,727 | $93,727 | $0 |
| 2013 | -- | $93,726 | $93,726 | $0 |
Source: Public Records
Map
Nearby Homes
- 77 Hensley Ln
- 1328 Mcneal Rd
- 1360 Mcneal Rd
- 1335 Mcneal Rd
- 1282 Mcneal Rd
- 1514 Mcneal Rd
- 100 Hensley Ln
- LOT 3 Mcneal Rd
- LOT 1 Mcneal Rd
- LOT 4 Mcneal Rd
- LOT 2 Mcneal Rd
- 1227 Mcneal Rd
- 000 Mcneal Rd
- 1254 Mcneal Rd
- 249 Leyland Way
- 248 Leyland Way
- 227 Leyland Way
- 16 Leyland Way
- 199 Leyland Way
- 214 Leyland Way