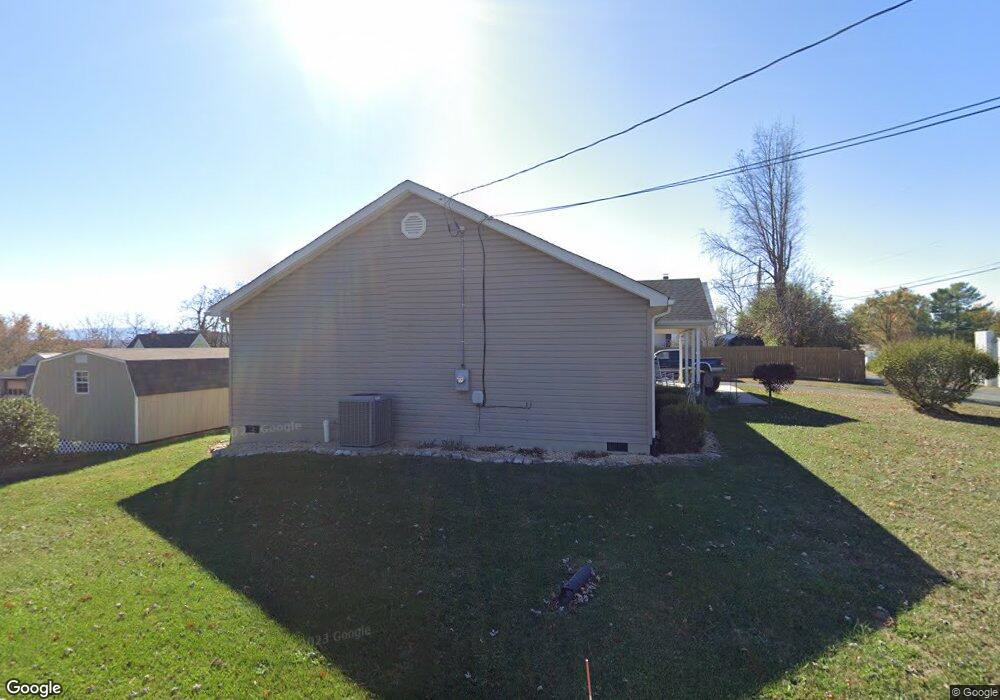
63 Highland Ave Fishersville, VA 22939
Estimated Value: $326,698 - $348,000
3
Beds
2
Baths
1,560
Sq Ft
$217/Sq Ft
Est. Value
About This Home
This home is located at 63 Highland Ave, Fishersville, VA 22939 and is currently estimated at $339,233, approximately $217 per square foot. 63 Highland Ave is a home located in Augusta County with nearby schools including Wilson Elementary School, Wilson Middle School, and Wilson Memorial High School.
Ownership History
Date
Name
Owned For
Owner Type
Purchase Details
Closed on
Dec 16, 2014
Sold by
Sexton Donna Lynn
Bought by
Davis Edward F and Davis Judy A
Current Estimated Value
Home Financials for this Owner
Home Financials are based on the most recent Mortgage that was taken out on this home.
Original Mortgage
$40,000
Outstanding Balance
$30,752
Interest Rate
4.02%
Mortgage Type
Land Contract Argmt. Of Sale
Estimated Equity
$308,481
Purchase Details
Closed on
Apr 30, 2010
Sold by
Kbl Construction Llc
Bought by
Southwick Carolyn J and Sexton Donna Lynn
Home Financials for this Owner
Home Financials are based on the most recent Mortgage that was taken out on this home.
Original Mortgage
$107,900
Interest Rate
4.99%
Mortgage Type
New Conventional
Create a Home Valuation Report for This Property
The Home Valuation Report is an in-depth analysis detailing your home's value as well as a comparison with similar homes in the area
Home Values in the Area
Average Home Value in this Area
Purchase History
| Date | Buyer | Sale Price | Title Company |
|---|---|---|---|
| Davis Edward F | $162,000 | Valley Southern Title | |
| Southwick Carolyn J | $172,900 | Court Square Title Agency Ll |
Source: Public Records
Mortgage History
| Date | Status | Borrower | Loan Amount |
|---|---|---|---|
| Open | Davis Edward F | $40,000 | |
| Previous Owner | Southwick Carolyn J | $107,900 |
Source: Public Records
Tax History Compared to Growth
Tax History
| Year | Tax Paid | Tax Assessment Tax Assessment Total Assessment is a certain percentage of the fair market value that is determined by local assessors to be the total taxable value of land and additions on the property. | Land | Improvement |
|---|---|---|---|---|
| 2025 | $1,369 | $266,800 | $60,000 | $206,800 |
| 2024 | $1,056 | $271,000 | $60,000 | $211,000 |
| 2023 | $1,056 | $167,600 | $50,000 | $117,600 |
| 2022 | $1,114 | $167,600 | $50,000 | $117,600 |
| 2021 | $1,114 | $167,600 | $50,000 | $117,600 |
| 2020 | $1,114 | $167,600 | $50,000 | $117,600 |
| 2019 | $1,114 | $167,600 | $50,000 | $117,600 |
| 2018 | $1,088 | $164,579 | $50,000 | $114,579 |
| 2017 | $1,002 | $164,579 | $50,000 | $114,579 |
| 2016 | $795 | $164,579 | $50,000 | $114,579 |
| 2015 | $795 | $164,579 | $50,000 | $114,579 |
| 2014 | $795 | $164,579 | $50,000 | $114,579 |
| 2013 | $795 | $165,600 | $50,000 | $115,600 |
Source: Public Records
Map
Nearby Homes
- 37 Peggys Ln
- 9 Walnut St
- 80 Antrim Rd
- 138 Virginia 285
- 20 Dirby Way
- 56 Church Hill Ln
- 197 Tinkling Spring Rd
- 213 Westminister Dr
- 0 Orr Dr
- 1885 Jefferson Hwy
- 38 J Ranch Ln
- LOT 28 Wilson Blvd
- 260 Windsor Dr
- 51 Windgate Cir Unit 203
- 58 Enchanted View Cir
- 1950 Jefferson Hwy
- 71 First St
- LOT 3 Wilson Blvd
- LOT 1 Wilson Blvd
- LOT 2 Wilson Blvd