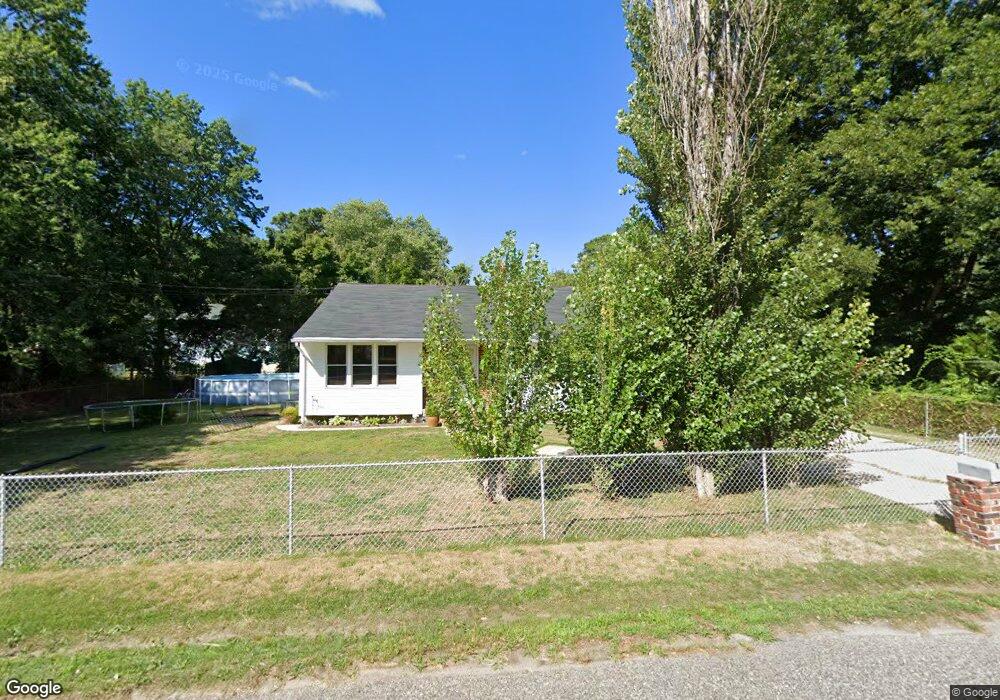
63 Hydrangea St Browns Mills, NJ 08015
Estimated Value: $309,000 - $327,881
3
Beds
2
Baths
1,512
Sq Ft
$212/Sq Ft
Est. Value
About This Home
This home is located at 63 Hydrangea St, Browns Mills, NJ 08015 and is currently estimated at $320,720, approximately $212 per square foot. 63 Hydrangea St is a home located in Burlington County.
Ownership History
Date
Name
Owned For
Owner Type
Purchase Details
Closed on
Feb 27, 2009
Sold by
Undercuffler Ricky K
Bought by
Gaztambide Frank
Current Estimated Value
Home Financials for this Owner
Home Financials are based on the most recent Mortgage that was taken out on this home.
Original Mortgage
$142,450
Outstanding Balance
$90,819
Interest Rate
5.18%
Mortgage Type
FHA
Estimated Equity
$229,901
Purchase Details
Closed on
Sep 29, 2008
Sold by
The Bank Of New York
Bought by
Undercliffer Ricky
Purchase Details
Closed on
Apr 21, 2008
Sold by
Cataldi Mark P and Cataldi Jennifer A
Bought by
The Bank Of New York
Purchase Details
Closed on
Jul 25, 2002
Sold by
Hud
Bought by
Cataldi Mark P and Cataldi Jennifer A
Home Financials for this Owner
Home Financials are based on the most recent Mortgage that was taken out on this home.
Original Mortgage
$68,400
Interest Rate
6.02%
Mortgage Type
Balloon
Purchase Details
Closed on
Nov 5, 2001
Sold by
Ridley Nancy L
Bought by
Hud
Purchase Details
Closed on
Jul 6, 1999
Sold by
Clark Jean L Watts
Bought by
Ridley Nancy Lee
Home Financials for this Owner
Home Financials are based on the most recent Mortgage that was taken out on this home.
Original Mortgage
$108,078
Interest Rate
7.39%
Mortgage Type
FHA
Create a Home Valuation Report for This Property
The Home Valuation Report is an in-depth analysis detailing your home's value as well as a comparison with similar homes in the area
Home Values in the Area
Average Home Value in this Area
Purchase History
| Date | Buyer | Sale Price | Title Company |
|---|---|---|---|
| Gaztambide Frank | $165,000 | Group 21 Title Agency | |
| Undercliffer Ricky | $100,100 | North American Title Agency | |
| The Bank Of New York | -- | Fidelity National Title Insu | |
| Cataldi Mark P | $85,500 | Fidelity National Title Ins | |
| Hud | -- | -- | |
| Ridley Nancy Lee | $109,000 | -- |
Source: Public Records
Mortgage History
| Date | Status | Borrower | Loan Amount |
|---|---|---|---|
| Open | Gaztambide Frank | $142,450 | |
| Previous Owner | Cataldi Mark P | $68,400 | |
| Previous Owner | Ridley Nancy Lee | $108,078 |
Source: Public Records
Tax History
| Year | Tax Paid | Tax Assessment Tax Assessment Total Assessment is a certain percentage of the fair market value that is determined by local assessors to be the total taxable value of land and additions on the property. | Land | Improvement |
|---|---|---|---|---|
| 2025 | $4,815 | $157,100 | $39,000 | $118,100 |
| 2024 | $4,518 | $157,100 | $39,000 | $118,100 |
| 2023 | $4,518 | $157,100 | $39,000 | $118,100 |
| 2022 | $4,182 | $157,100 | $39,000 | $118,100 |
| 2021 | $4,011 | $157,100 | $39,000 | $118,100 |
| 2020 | $3,860 | $157,100 | $39,000 | $118,100 |
| 2019 | $3,697 | $157,100 | $39,000 | $118,100 |
| 2018 | $3,571 | $157,100 | $39,000 | $118,100 |
| 2017 | $3,497 | $157,100 | $39,000 | $118,100 |
| 2016 | $4,026 | $107,700 | $21,100 | $86,600 |
| 2015 | $3,994 | $107,700 | $21,100 | $86,600 |
| 2014 | $3,818 | $107,700 | $21,100 | $86,600 |
Source: Public Records
Map
Nearby Homes
- 12 Sage St
- 68 Briar St
- 16 Begonia St
- 2000 S Lakeshore Dr
- 0 S Lakeshore Dr
- 33 Teaberry St
- 69 Aster St
- 525 Larch Ave
- 62 Aster St
- 37 Fern St
- 30 Fern St
- 1201 Hanover Blvd
- 0 Aster St & Elm
- 2601 N Lakeshore Dr
- 200 Rugby St
- 228 Bayberry St
- 301 N Lakeshore Dr
- 303 Bayberry St
- 601 E Lakeshore Dr
- 118 Syringa St
- 1500 S Brynwood Dr
- 62 Gladiolus St
- 65 Barclay St
- 60 Hydrangea St
- 54 Gladiolus St
- 104 Barclay St
- 1501 S Brynwood Dr
- 52 Hydrangea St
- 61 Gladiolus St
- 1602 S Brynwood Dr
- 103 Barclay St
- 44 Hydrangea St
- 42 Gladiolus St
- 0 Gladiolus St
- 106 Plymouth St
- 32 Gladiolus St
- 120 Barclay St
- 64 Geranium St
- 1400 S Brynwood Dr
- 56 Geranium St
Your Personal Tour Guide
Ask me questions while you tour the home.