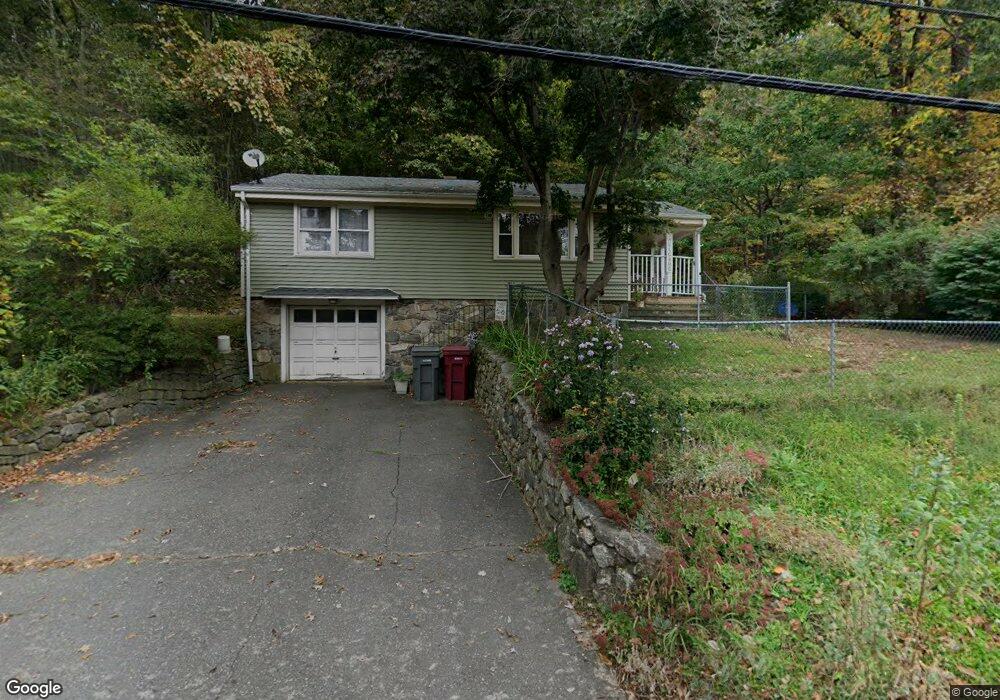
63 Jones Rd Naugatuck, CT 06770
Estimated Value: $275,000 - $298,000
2
Beds
1
Bath
816
Sq Ft
$352/Sq Ft
Est. Value
About This Home
This home is located at 63 Jones Rd, Naugatuck, CT 06770 and is currently estimated at $287,512, approximately $352 per square foot. 63 Jones Rd is a home located in New Haven County with nearby schools including City Hill Middle School and Naugatuck High School.
Ownership History
Date
Name
Owned For
Owner Type
Purchase Details
Closed on
Jun 1, 2010
Sold by
Paternoster Michael J and Duby Patricia A
Bought by
Quinn Shauna L
Current Estimated Value
Home Financials for this Owner
Home Financials are based on the most recent Mortgage that was taken out on this home.
Original Mortgage
$133,206
Outstanding Balance
$89,973
Interest Rate
5.13%
Mortgage Type
Purchase Money Mortgage
Estimated Equity
$197,539
Purchase Details
Closed on
Mar 4, 2003
Sold by
Perregaux Gary R
Bought by
Paternoster Michael J and Duby Patricia A
Home Financials for this Owner
Home Financials are based on the most recent Mortgage that was taken out on this home.
Original Mortgage
$122,500
Interest Rate
5.98%
Mortgage Type
Purchase Money Mortgage
Purchase Details
Closed on
Nov 3, 1995
Sold by
Porzio Thomas
Bought by
Perregaux Gary and Perregaux Margaret
Create a Home Valuation Report for This Property
The Home Valuation Report is an in-depth analysis detailing your home's value as well as a comparison with similar homes in the area
Home Values in the Area
Average Home Value in this Area
Purchase History
| Date | Buyer | Sale Price | Title Company |
|---|---|---|---|
| Quinn Shauna L | $135,000 | -- | |
| Paternoster Michael J | $124,500 | -- | |
| Perregaux Gary | $67,000 | -- |
Source: Public Records
Mortgage History
| Date | Status | Borrower | Loan Amount |
|---|---|---|---|
| Open | Perregaux Gary | $133,206 | |
| Previous Owner | Perregaux Gary | $122,500 | |
| Previous Owner | Perregaux Gary | $42,250 | |
| Previous Owner | Perregaux Gary | $72,000 |
Source: Public Records
Tax History
| Year | Tax Paid | Tax Assessment Tax Assessment Total Assessment is a certain percentage of the fair market value that is determined by local assessors to be the total taxable value of land and additions on the property. | Land | Improvement |
|---|---|---|---|---|
| 2025 | $5,420 | $136,220 | $35,350 | $100,870 |
| 2024 | $5,693 | $136,220 | $35,350 | $100,870 |
| 2023 | $6,096 | $136,220 | $35,350 | $100,870 |
| 2022 | $4,543 | $95,140 | $37,710 | $57,430 |
| 2021 | $4,543 | $95,140 | $37,710 | $57,430 |
| 2020 | $4,543 | $95,140 | $37,710 | $57,430 |
| 2019 | $4,495 | $95,140 | $37,710 | $57,430 |
| 2018 | $4,589 | $94,920 | $48,220 | $46,700 |
| 2017 | $4,608 | $94,920 | $48,220 | $46,700 |
| 2016 | $4,525 | $94,920 | $48,220 | $46,700 |
| 2015 | $4,326 | $94,920 | $48,220 | $46,700 |
| 2014 | $4,277 | $94,920 | $48,220 | $46,700 |
| 2012 | $4,518 | $134,670 | $57,540 | $77,130 |
Source: Public Records
Map
Nearby Homes
- 75 Allerton Rd
- 671 Rubber Ave
- 233 Conrad St
- 51 Joseph Rd
- 0 Westover Dr
- 92 Birch Ln
- 72 Hilltop Rd
- 31 Pilgrim Ln
- 470 Rubber Ave
- 97 Timothy Rd
- 49 Damson Ln
- 309 N Hoadley St
- 89 N Hoadley St
- 167 N Hoadley St
- 28 Tower Ln
- 54 Bridle Trail Dr
- 150 Millville Ave
- 48 Round Tree Dr Unit 5
- 57 Mistywood Ln
- 0 Andrew Mountain Rd Unit 170603648
Your Personal Tour Guide
Ask me questions while you tour the home.