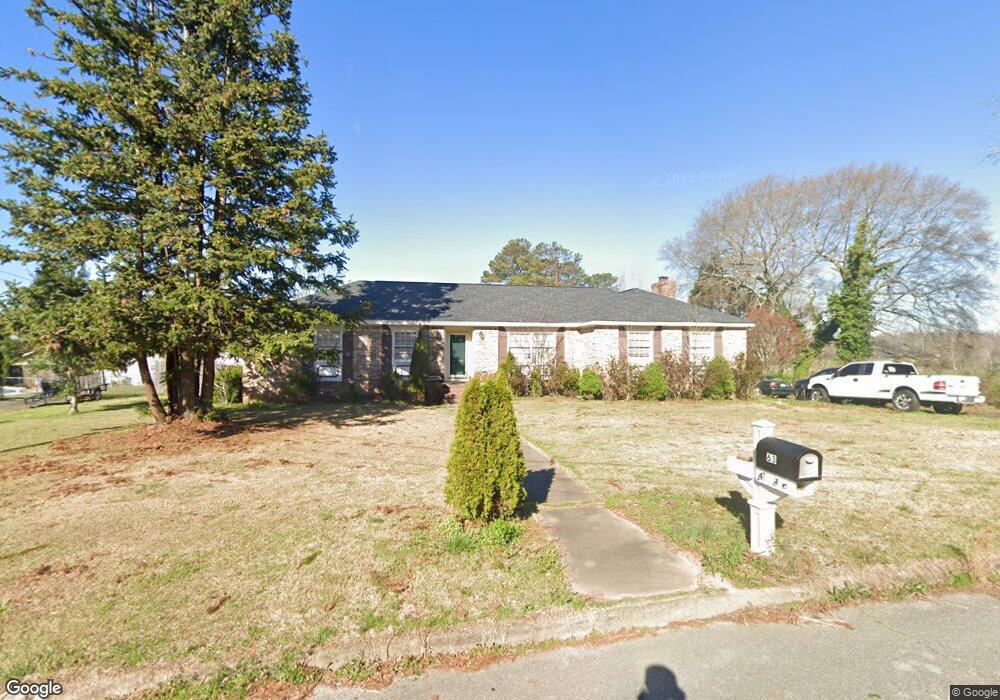
63 Kay Ln Roanoke, AL 36274
Estimated Value: $177,772 - $256,000
--
Bed
--
Bath
1,677
Sq Ft
$128/Sq Ft
Est. Value
About This Home
This home is located at 63 Kay Ln, Roanoke, AL 36274 and is currently estimated at $215,193, approximately $128 per square foot. 63 Kay Ln is a home located in Randolph County with nearby schools including Knight Enloe Elementary School, Handley Middle School, and Handley High School.
Ownership History
Date
Name
Owned For
Owner Type
Purchase Details
Closed on
Mar 15, 2022
Sold by
Adan Oseguera
Bought by
Palmer Gregory L
Current Estimated Value
Home Financials for this Owner
Home Financials are based on the most recent Mortgage that was taken out on this home.
Original Mortgage
$162,011
Outstanding Balance
$151,251
Interest Rate
3.85%
Mortgage Type
FHA
Estimated Equity
$63,942
Purchase Details
Closed on
Jun 9, 2016
Sold by
Jones Frankie W and Jones Sybil E
Bought by
Oseguera Adan
Home Financials for this Owner
Home Financials are based on the most recent Mortgage that was taken out on this home.
Original Mortgage
$119,653
Interest Rate
3.66%
Mortgage Type
Purchase Money Mortgage
Purchase Details
Closed on
Mar 14, 2008
Sold by
Gill Vivian A
Bought by
Jones Frankie W and Jones Sybil E
Home Financials for this Owner
Home Financials are based on the most recent Mortgage that was taken out on this home.
Original Mortgage
$137,934
Interest Rate
5.68%
Create a Home Valuation Report for This Property
The Home Valuation Report is an in-depth analysis detailing your home's value as well as a comparison with similar homes in the area
Home Values in the Area
Average Home Value in this Area
Purchase History
| Date | Buyer | Sale Price | Title Company |
|---|---|---|---|
| Palmer Gregory L | $165,000 | Law Firm Of Kesa M Johnston Ll | |
| Oseguera Adan | $130,000 | -- | |
| Jones Frankie W | -- | -- |
Source: Public Records
Mortgage History
| Date | Status | Borrower | Loan Amount |
|---|---|---|---|
| Open | Palmer Gregory L | $162,011 | |
| Previous Owner | Oseguera Adan | $119,653 | |
| Previous Owner | Jones Frankie W | $137,934 |
Source: Public Records
Tax History Compared to Growth
Tax History
| Year | Tax Paid | Tax Assessment Tax Assessment Total Assessment is a certain percentage of the fair market value that is determined by local assessors to be the total taxable value of land and additions on the property. | Land | Improvement |
|---|---|---|---|---|
| 2024 | $1,121 | $26,700 | $1,680 | $25,020 |
| 2023 | $1,121 | $11,420 | $740 | $10,680 |
| 2022 | $476 | $11,420 | $740 | $10,680 |
| 2021 | $476 | $11,420 | $740 | $10,680 |
| 2020 | $480 | $11,420 | $740 | $10,680 |
| 2018 | $417 | $9,920 | $740 | $9,180 |
| 2017 | $454 | $10,820 | $740 | $10,080 |
| 2016 | $329 | $9,720 | $740 | $8,980 |
| 2015 | $329 | $97,205 | $0 | $0 |
| 2014 | $361 | $97,205 | $0 | $0 |
| 2013 | -- | $103,187 | $0 | $0 |
Source: Public Records
Map
Nearby Homes
- 925 Crestwood Dr
- Lot 6 Mary Dr Unit 6
- Lot 13 Mary Dr Unit 13
- Lot 7 Mary Dr Unit 7
- 435 South St
- Lot 18 Dogwood Cir Unit 1
- 1429 Fairway Dr
- 269 Longshore St
- 972 Strong St
- 470 Gilham Rd
- 0 Fairway Dr Unit 8 21409891
- 818 Heflin Ave
- 646 Mickle Dr
- 2950 Highway 431 Unit 7.5 Ac
- 231 College St
- 12 Acres County Road 241
- 230 Lafayette St
- 63445 Alabama 22 Unit 70 Ac
- 3000 Country Club Rd Unit 1
- 524 Louina Rd
- 39 Kay Ln
- 42 Melody Ln
- 104 Spring Hill Dr
- 81 Melody Ln
- 62 Melody Ln
- 81 Melody Ln
- 81 Melody Ln
- 38 Spring Hill Dr
- 47 Melody Ln
- 1420 Lafayette Hwy
- 17 Ziglar Blvd
- 1389 Lafayette Hwy
- 7.9 Acres Lafayette Hwy
- 1449 Lafayette Hwy
- 61 Ziglar Blvd
- 0 Ziglar Blvd Unit 7005413
- 0 Ziglar Blvd
- 224 Spring Hill Dr
- 157 Spring Hill Dr
- 157 Spring Hill Dr