Estimated Value: $577,000 - $648,000
2
Beds
1
Bath
1,286
Sq Ft
$470/Sq Ft
Est. Value
About This Home
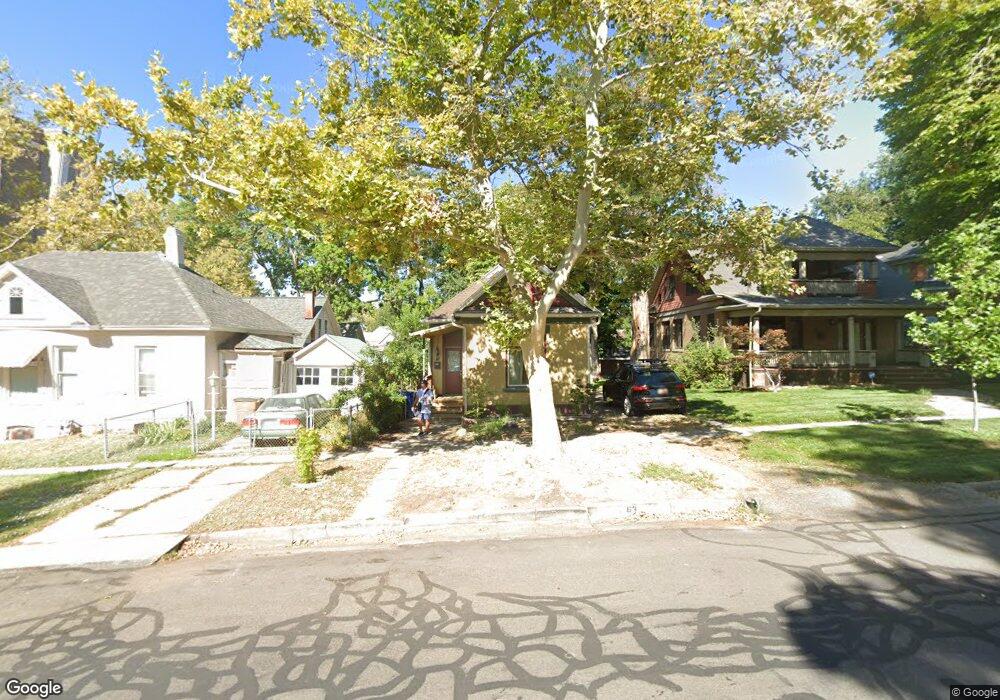
This home is located at 63 L St, Salt Lake City, UT 84103 and is currently estimated at $604,901, approximately $470 per square foot. 63 L St is a home located in Salt Lake County with nearby schools including Wasatch Elementary School, West High, and Open Classroom.
Ownership History
Date
Name
Owned For
Owner Type
Purchase Details
Closed on
Sep 9, 2021
Sold by
Nicholas Franchi
Bought by
Finch Kevin G and Finch Alexa M
Current Estimated Value
Home Financials for this Owner
Home Financials are based on the most recent Mortgage that was taken out on this home.
Original Mortgage
$451,250
Outstanding Balance
$410,604
Interest Rate
2.8%
Mortgage Type
New Conventional
Estimated Equity
$194,297
Purchase Details
Closed on
May 30, 2012
Sold by
Barwick Christian S and Barwick Niki L
Bought by
Franchi Nicholas
Home Financials for this Owner
Home Financials are based on the most recent Mortgage that was taken out on this home.
Original Mortgage
$264,029
Interest Rate
3.86%
Mortgage Type
FHA
Purchase Details
Closed on
Mar 14, 2007
Sold by
Woodward Niki L and Barwick Niki L
Bought by
Barwick Christian S and Barwick Niki L
Home Financials for this Owner
Home Financials are based on the most recent Mortgage that was taken out on this home.
Original Mortgage
$279,000
Interest Rate
5.65%
Mortgage Type
New Conventional
Purchase Details
Closed on
Nov 1, 2006
Sold by
Ashbridge Daniel and Throndsen Jennifer
Bought by
Barwick Christian S and Woodward Niki L
Home Financials for this Owner
Home Financials are based on the most recent Mortgage that was taken out on this home.
Original Mortgage
$39,750
Interest Rate
6.36%
Mortgage Type
Credit Line Revolving
Purchase Details
Closed on
Mar 24, 2006
Sold by
Armstrong Megan C
Bought by
Ashbridge Daniel and Throndsen Jennifer
Home Financials for this Owner
Home Financials are based on the most recent Mortgage that was taken out on this home.
Original Mortgage
$149,500
Interest Rate
7.75%
Mortgage Type
New Conventional
Purchase Details
Closed on
May 23, 2002
Sold by
Startup Marilyn and Startup Isaac M
Bought by
Armstrong Megan C
Home Financials for this Owner
Home Financials are based on the most recent Mortgage that was taken out on this home.
Original Mortgage
$107,200
Interest Rate
7.62%
Purchase Details
Closed on
Jan 6, 1997
Sold by
Startup Marilyn
Bought by
Startup Marilynn and Startup Isaac M
Home Financials for this Owner
Home Financials are based on the most recent Mortgage that was taken out on this home.
Original Mortgage
$75,000
Interest Rate
7.53%
Purchase Details
Closed on
Oct 27, 1995
Sold by
Bode Margaret Ann
Bought by
Startup Marilynn
Create a Home Valuation Report for This Property
The Home Valuation Report is an in-depth analysis detailing your home's value as well as a comparison with similar homes in the area
Home Values in the Area
Average Home Value in this Area
Purchase History
| Date | Buyer | Sale Price | Title Company |
|---|---|---|---|
| Finch Kevin G | -- | Real Advantage Ttl Ins Agcy | |
| Franchi Nicholas | -- | Inwest Title Services | |
| Barwick Christian S | -- | Bonneville Superior Title | |
| Barwick Christian S | -- | Founders Title | |
| Ashbridge Daniel | -- | United Title Services | |
| Armstrong Megan C | -- | Backman Stewart Title Servic | |
| Startup Marilynn | -- | -- | |
| Startup Marilynn | -- | -- |
Source: Public Records
Mortgage History
| Date | Status | Borrower | Loan Amount |
|---|---|---|---|
| Open | Finch Kevin G | $451,250 | |
| Previous Owner | Franchi Nicholas | $264,029 | |
| Previous Owner | Barwick Christian S | $279,000 | |
| Previous Owner | Barwick Christian S | $39,750 | |
| Previous Owner | Barwick Christian S | $212,000 | |
| Previous Owner | Ashbridge Daniel | $149,500 | |
| Previous Owner | Armstrong Megan C | $107,200 | |
| Previous Owner | Startup Marilynn | $75,000 | |
| Closed | Armstrong Megan C | $26,800 |
Source: Public Records
Tax History Compared to Growth
Tax History
| Year | Tax Paid | Tax Assessment Tax Assessment Total Assessment is a certain percentage of the fair market value that is determined by local assessors to be the total taxable value of land and additions on the property. | Land | Improvement |
|---|---|---|---|---|
| 2025 | $2,525 | $557,100 | $167,200 | $389,900 |
| 2024 | $2,525 | $481,700 | $159,600 | $322,100 |
| 2023 | $2,527 | $464,700 | $153,400 | $311,300 |
| 2022 | $2,779 | $479,500 | $150,400 | $329,100 |
| 2021 | $3,069 | $388,900 | $122,400 | $266,500 |
| 2020 | $2,511 | $373,400 | $117,800 | $255,600 |
| 2019 | $2,259 | $316,000 | $110,800 | $205,200 |
| 2018 | $2,096 | $285,500 | $110,800 | $174,700 |
| 2017 | $2,155 | $275,100 | $110,800 | $164,300 |
| 2016 | $2,214 | $268,300 | $118,400 | $149,900 |
| 2015 | $2,329 | $267,600 | $94,700 | $172,900 |
| 2014 | $2,261 | $257,700 | $94,700 | $163,000 |
Source: Public Records
Map
Nearby Homes
- 777 E 2nd Ave Unit 3
- 777 E South Temple Unit 15D
- 777 E South Temple Unit 13A
- 777 E South Temple Unit 10D
- 777 E South Temple Unit 10d
- 777 E South Temple Unit 3J
- 777 E South Temple Unit 11F
- 777 E South Temple Unit 3F
- 777 E South Temple Unit 7H
- 777 E South Temple Unit 4C
- 777 E South Temple Unit 4A
- 777 E South Temple Unit 15E
- 777 E South Temple Unit 13B
- 777 E South Temple Unit 9J
- 777 E South Temple Unit 4B
- 839 E South Temple Unit 102
- 839 E South Temple Unit 99
- 777 E South Temple St Unit 11B
- 777 E South Temple St Unit 4I
- 777 E South Temple St Unit 6F
- 733 E 1st Ave
- 733 1st Ave
- 737 1st Ave
- 727 1st Ave
- 723 1st Ave
- 81 S State St Unit NL
- 751 1st Ave
- 751 E 1st Ave
- 70 L St
- 724 2nd Ave
- 124 S State St Unit NT
- 124 S State St Unit NU
- 124 S State St Unit NS
- 124 S State St Unit NM
- 124 S State St Unit NI
- 718 E 2nd Ave
- 718 2nd Ave
- 728 2nd Ave
- 757 1st Ave
- 757 E 1st Ave