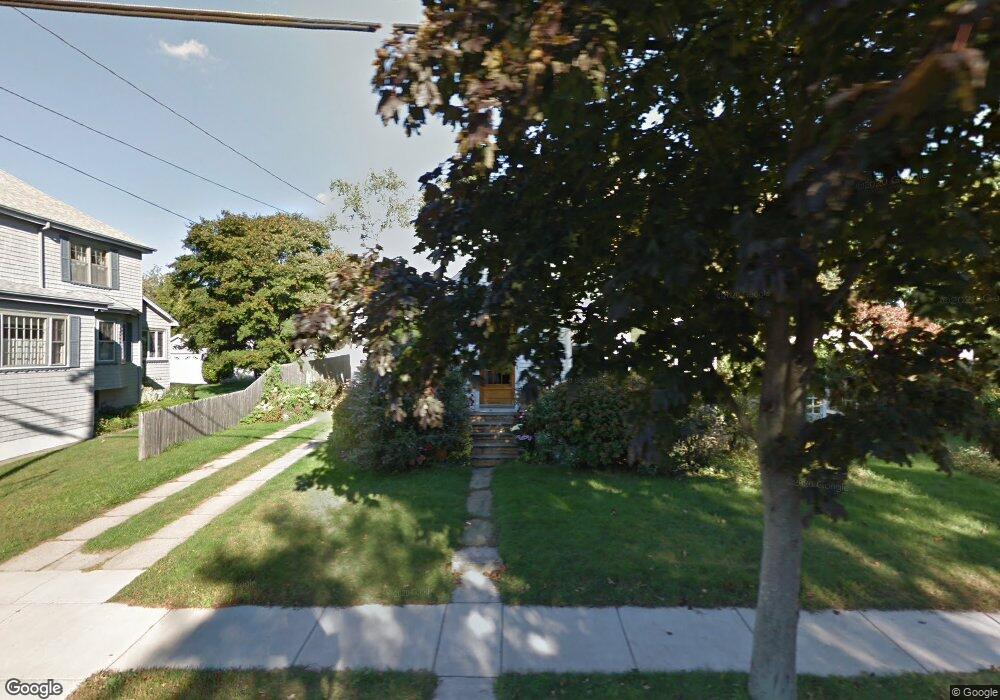
63 Laurel St Fairhaven, MA 02719
Estimated Value: $460,000 - $652,000
3
Beds
2
Baths
962
Sq Ft
$550/Sq Ft
Est. Value
About This Home
This home is located at 63 Laurel St, Fairhaven, MA 02719 and is currently estimated at $529,252, approximately $550 per square foot. 63 Laurel St is a home located in Bristol County with nearby schools including Fairhaven High School, City On A Hill Charter Public School New Bedford, and St. Joseph School.
Ownership History
Date
Name
Owned For
Owner Type
Purchase Details
Closed on
Nov 22, 1995
Sold by
Sherman Helen P Est and Lowney Ann F
Bought by
Volk Elaine M and Marx Craig L
Current Estimated Value
Home Financials for this Owner
Home Financials are based on the most recent Mortgage that was taken out on this home.
Original Mortgage
$77,000
Outstanding Balance
$1,064
Interest Rate
7.47%
Mortgage Type
Purchase Money Mortgage
Estimated Equity
$528,188
Create a Home Valuation Report for This Property
The Home Valuation Report is an in-depth analysis detailing your home's value as well as a comparison with similar homes in the area
Home Values in the Area
Average Home Value in this Area
Purchase History
| Date | Buyer | Sale Price | Title Company |
|---|---|---|---|
| Volk Elaine M | $127,000 | -- |
Source: Public Records
Mortgage History
| Date | Status | Borrower | Loan Amount |
|---|---|---|---|
| Open | Volk Elaine M | $77,000 |
Source: Public Records
Tax History
| Year | Tax Paid | Tax Assessment Tax Assessment Total Assessment is a certain percentage of the fair market value that is determined by local assessors to be the total taxable value of land and additions on the property. | Land | Improvement |
|---|---|---|---|---|
| 2025 | $45 | $481,900 | $248,400 | $233,500 |
| 2024 | $4,316 | $467,600 | $248,400 | $219,200 |
| 2023 | $3,969 | $398,900 | $214,300 | $184,600 |
| 2022 | $3,800 | $371,800 | $195,200 | $176,600 |
| 2021 | $4,025 | $329,500 | $177,400 | $152,100 |
| 2020 | $3,644 | $329,500 | $177,400 | $152,100 |
| 2019 | $3,478 | $298,000 | $152,000 | $146,000 |
| 2018 | $2,095 | $283,500 | $144,700 | $138,800 |
| 2017 | $3,233 | $268,500 | $139,200 | $129,300 |
| 2016 | $3,201 | $262,800 | $136,500 | $126,300 |
| 2015 | $3,073 | $252,900 | $136,500 | $116,400 |
Source: Public Records
Map
Nearby Homes
- 70 Chestnut St
- 32 Green St
- 11 Lawton St
- 32 Cedar St
- 2 Washburn Ave
- 24 Middle St
- 58 Washington St
- 0 Nulands Neck Unit 73286360
- 132 Pleasant St
- 8 Washington St
- 54 William St
- 145 Pleasant St
- 78 Middle St
- 39 Christian St
- 77 Adams St
- 67 Bridge St
- 8 Manor Dr
- 181 Washington St
- 138 Main St Unit 13
- 48 Bellevue St
Your Personal Tour Guide
Ask me questions while you tour the home.