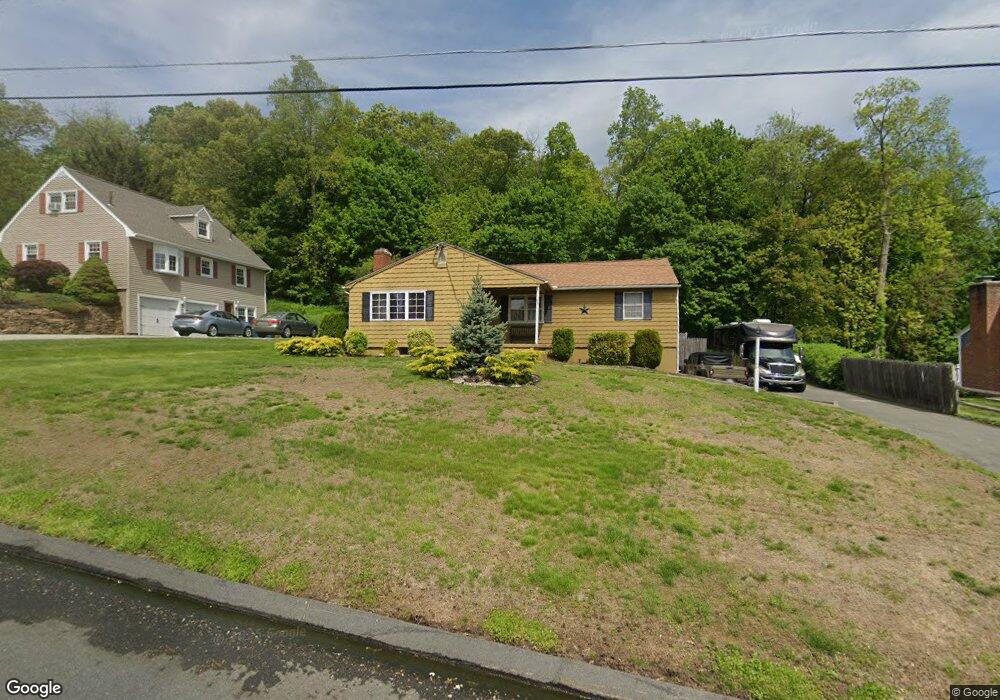
63 Laurence Dr West Springfield, MA 01089
Estimated Value: $368,501 - $447,000
3
Beds
2
Baths
1,438
Sq Ft
$282/Sq Ft
Est. Value
About This Home
This home is located at 63 Laurence Dr, West Springfield, MA 01089 and is currently estimated at $405,875, approximately $282 per square foot. 63 Laurence Dr is a home located in Hampden County with nearby schools including West Springfield High School, Hampden Charter School of Science West, and St Thomas The Apostle School.
Ownership History
Date
Name
Owned For
Owner Type
Purchase Details
Closed on
Jul 29, 2005
Sold by
Emerson Denise
Bought by
Wallen Eldon A
Current Estimated Value
Home Financials for this Owner
Home Financials are based on the most recent Mortgage that was taken out on this home.
Original Mortgage
$175,181
Outstanding Balance
$92,084
Interest Rate
5.67%
Mortgage Type
Purchase Money Mortgage
Estimated Equity
$313,791
Purchase Details
Closed on
May 21, 2003
Sold by
Cote Judith A and Cote Thomas A
Bought by
Emerson Denise and Emerson Gerard
Home Financials for this Owner
Home Financials are based on the most recent Mortgage that was taken out on this home.
Original Mortgage
$176,550
Interest Rate
5.86%
Mortgage Type
Purchase Money Mortgage
Create a Home Valuation Report for This Property
The Home Valuation Report is an in-depth analysis detailing your home's value as well as a comparison with similar homes in the area
Home Values in the Area
Average Home Value in this Area
Purchase History
| Date | Buyer | Sale Price | Title Company |
|---|---|---|---|
| Wallen Eldon A | $218,977 | -- | |
| Emerson Denise | $182,000 | -- |
Source: Public Records
Mortgage History
| Date | Status | Borrower | Loan Amount |
|---|---|---|---|
| Open | Wallen Eldon A | $175,181 | |
| Closed | Wallen Eldon A | $32,847 | |
| Previous Owner | Emerson Denise | $176,550 |
Source: Public Records
Tax History
| Year | Tax Paid | Tax Assessment Tax Assessment Total Assessment is a certain percentage of the fair market value that is determined by local assessors to be the total taxable value of land and additions on the property. | Land | Improvement |
|---|---|---|---|---|
| 2025 | $4,785 | $321,800 | $126,400 | $195,400 |
| 2024 | $4,720 | $318,700 | $126,400 | $192,300 |
| 2023 | $4,542 | $292,300 | $126,400 | $165,900 |
| 2022 | $4,109 | $260,700 | $114,800 | $145,900 |
| 2021 | $3,963 | $234,500 | $106,800 | $127,700 |
| 2020 | $3,976 | $234,000 | $106,800 | $127,200 |
| 2019 | $3,969 | $234,000 | $106,800 | $127,200 |
| 2018 | $3,990 | $234,000 | $106,800 | $127,200 |
| 2017 | $3,990 | $234,000 | $106,800 | $127,200 |
| 2016 | $3,965 | $233,400 | $102,700 | $130,700 |
| 2015 | $3,887 | $228,800 | $100,700 | $128,100 |
| 2014 | $944 | $228,800 | $100,700 | $128,100 |
Source: Public Records
Map
Nearby Homes
- 53 Laurence Dr
- 73 Laurence Dr
- 45 Laurence Dr
- 62 Laurence Dr
- 72 Laurence Dr
- 82 Laurence Dr
- 48 Laurence Dr
- 35 Laurence Dr
- 89 Laurence Dr
- 42 Crestview Dr
- 90 Laurence Dr
- 38 Laurence Dr
- 39 Crestview Dr
- 25 Laurence Dr
- 30 Crestview Dr
- 28 Laurence Dr
- 99 Laurence Dr
- 31 Crestview Dr
- 100 Laurence Dr
- 21 Crestview Dr
Your Personal Tour Guide
Ask me questions while you tour the home.