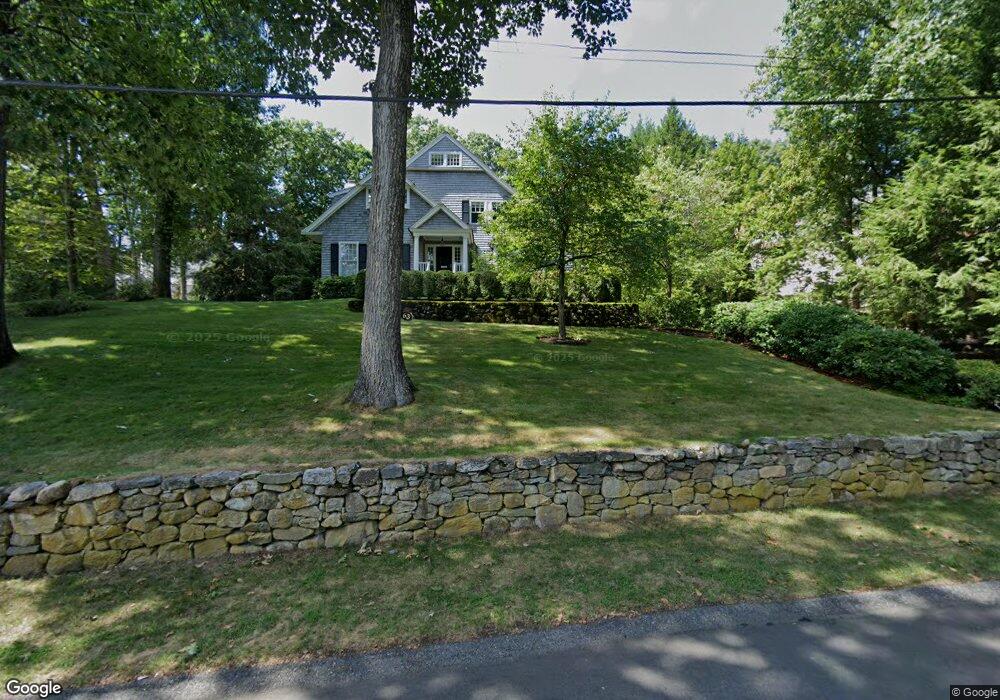
63 Ledgeways Wellesley Hills, MA 02481
Wellesley Farms NeighborhoodEstimated Value: $3,368,332 - $4,047,000
5
Beds
6
Baths
5,100
Sq Ft
$734/Sq Ft
Est. Value
About This Home
This home is located at 63 Ledgeways, Wellesley Hills, MA 02481 and is currently estimated at $3,744,444, approximately $734 per square foot. 63 Ledgeways is a home located in Norfolk County with nearby schools including Sprague Elementary School, Wellesley Middle School, and Wellesley Sr High School.
Ownership History
Date
Name
Owned For
Owner Type
Purchase Details
Closed on
Aug 14, 1998
Sold by
Fidelity Corp R E Llc
Bought by
Flannery Joseph P
Current Estimated Value
Purchase Details
Closed on
Jul 31, 1998
Sold by
Senter Max S
Bought by
Fidelity Corp Rl Est
Purchase Details
Closed on
May 26, 1992
Sold by
Newton Exr Louise R
Bought by
Posey Pamela E
Create a Home Valuation Report for This Property
The Home Valuation Report is an in-depth analysis detailing your home's value as well as a comparison with similar homes in the area
Home Values in the Area
Average Home Value in this Area
Purchase History
| Date | Buyer | Sale Price | Title Company |
|---|---|---|---|
| Flannery Joseph P | $1,895,000 | -- | |
| Fidelity Corp Rl Est | $1,825,000 | -- | |
| Posey Pamela E | $418,000 | -- |
Source: Public Records
Mortgage History
| Date | Status | Borrower | Loan Amount |
|---|---|---|---|
| Previous Owner | Posey Pamela E | $655,000 | |
| Previous Owner | Posey Pamela E | $675,000 | |
| Previous Owner | Posey Pamela E | $675,000 |
Source: Public Records
Tax History Compared to Growth
Tax History
| Year | Tax Paid | Tax Assessment Tax Assessment Total Assessment is a certain percentage of the fair market value that is determined by local assessors to be the total taxable value of land and additions on the property. | Land | Improvement |
|---|---|---|---|---|
| 2025 | $28,208 | $2,744,000 | $1,544,000 | $1,200,000 |
| 2024 | $26,056 | $2,503,000 | $1,343,000 | $1,160,000 |
| 2023 | $25,728 | $2,247,000 | $1,190,000 | $1,057,000 |
| 2022 | $23,886 | $2,045,000 | $1,066,000 | $979,000 |
| 2021 | $23,500 | $2,000,000 | $1,021,000 | $979,000 |
| 2020 | $23,120 | $2,000,000 | $1,021,000 | $979,000 |
| 2019 | $23,140 | $2,000,000 | $1,021,000 | $979,000 |
| 2018 | $23,398 | $1,958,000 | $907,000 | $1,051,000 |
| 2017 | $23,097 | $1,959,000 | $908,000 | $1,051,000 |
| 2016 | $23,435 | $1,981,000 | $892,000 | $1,089,000 |
| 2015 | $22,935 | $1,984,000 | $892,000 | $1,092,000 |
Source: Public Records
Map
Nearby Homes