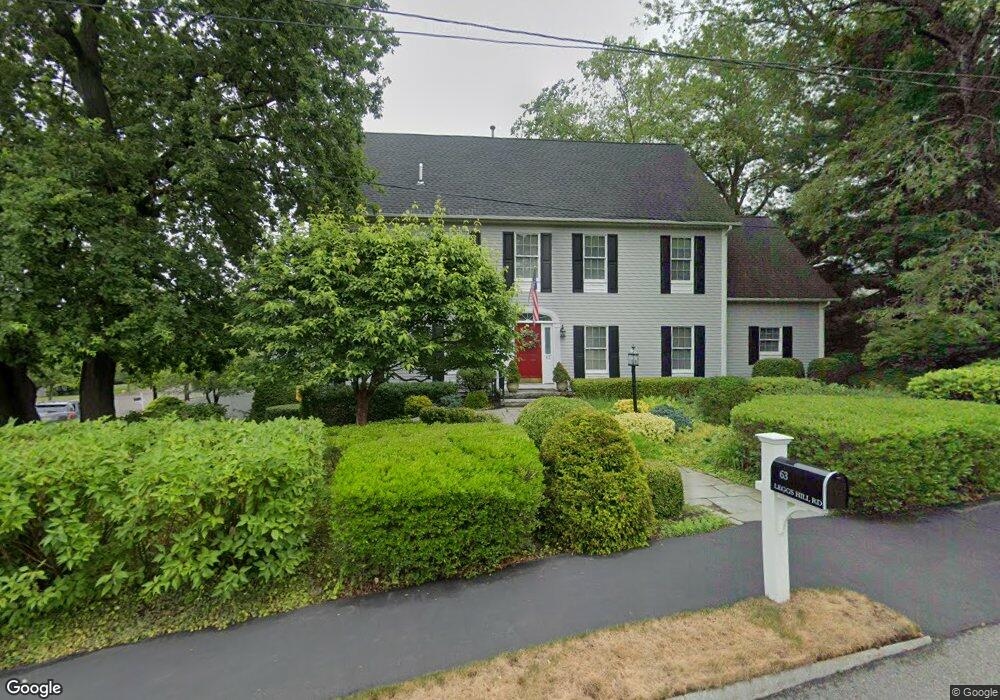
63 Leggs Hill Rd Marblehead, MA 01945
Estimated Value: $1,224,000 - $1,345,000
4
Beds
5
Baths
2,772
Sq Ft
$462/Sq Ft
Est. Value
About This Home
This home is located at 63 Leggs Hill Rd, Marblehead, MA 01945 and is currently estimated at $1,281,184, approximately $462 per square foot. 63 Leggs Hill Rd is a home located in Essex County with nearby schools including Marblehead High School, Devereux School, and Tower School.
Ownership History
Date
Name
Owned For
Owner Type
Purchase Details
Closed on
Apr 1, 2025
Sold by
Dana Anita B and Dana Gregory S
Bought by
Anita B Dana T B and Anita Dana
Current Estimated Value
Purchase Details
Closed on
Nov 6, 2017
Sold by
Dana Gregory S and Dana Anita B
Bought by
Dana Gregory S and Dan Anita B
Purchase Details
Closed on
Jun 10, 2003
Sold by
Peaslee Donald W and Peaslee Sandra K
Bought by
2B Lots and Riversid 16B
Purchase Details
Closed on
Feb 4, 2003
Sold by
2B Lots and Riversid 16B
Bought by
Peaslee Donald W
Purchase Details
Closed on
Mar 18, 1996
Sold by
Angenica Mario and Angenica Camille
Bought by
Lots 2B & 16B Riverside and Peaslee
Create a Home Valuation Report for This Property
The Home Valuation Report is an in-depth analysis detailing your home's value as well as a comparison with similar homes in the area
Home Values in the Area
Average Home Value in this Area
Purchase History
| Date | Buyer | Sale Price | Title Company |
|---|---|---|---|
| Anita B Dana T B | -- | None Available | |
| Anita B Dana T B | -- | None Available | |
| Anita B Dana T B | -- | None Available | |
| Dana Gregory S | -- | -- | |
| Dana Gregory S | -- | -- | |
| Dan Anita B | -- | -- | |
| Dana Gregory S | -- | -- | |
| Dana Gregory S | -- | -- | |
| Dana Gregory S | -- | -- | |
| Dana Gregory S | -- | -- | |
| Dan Anita B | -- | -- | |
| Dan Anita B | -- | -- | |
| 2B Lots | -- | -- | |
| Lots 2B | -- | -- | |
| Peaslee Donald W | -- | -- | |
| Peaslee Donald W | -- | -- | |
| Lots 2B & 16B Riverside | $143,000 | -- | |
| Lots 2B & 16B Riverside | $143,000 | -- |
Source: Public Records
Mortgage History
| Date | Status | Borrower | Loan Amount |
|---|---|---|---|
| Previous Owner | Lots 2B & 16B Riverside | $210,000 | |
| Previous Owner | Lots 2B & 16B Riverside | $50,000 |
Source: Public Records
Tax History Compared to Growth
Tax History
| Year | Tax Paid | Tax Assessment Tax Assessment Total Assessment is a certain percentage of the fair market value that is determined by local assessors to be the total taxable value of land and additions on the property. | Land | Improvement |
|---|---|---|---|---|
| 2025 | $10,623 | $1,173,800 | $607,200 | $566,600 |
| 2024 | $10,339 | $1,153,900 | $607,100 | $546,800 |
| 2023 | $9,876 | $987,600 | $553,200 | $434,400 |
| 2022 | $9,717 | $923,700 | $499,200 | $424,500 |
| 2021 | $9,134 | $876,600 | $458,700 | $417,900 |
| 2020 | $9,006 | $866,800 | $458,700 | $408,100 |
| 2019 | $8,693 | $809,400 | $418,300 | $391,100 |
| 2018 | $8,622 | $782,400 | $391,300 | $391,100 |
| 2017 | $8,317 | $755,400 | $364,300 | $391,100 |
| 2016 | $8,085 | $728,400 | $337,300 | $391,100 |
| 2015 | $7,838 | $707,400 | $310,300 | $397,100 |
| 2014 | $7,384 | $665,800 | $283,300 | $382,500 |
Source: Public Records
Map
Nearby Homes
- 19 Elmwood Rd
- 25 Tedesco St
- 5 Elmwood Rd
- 201 Humphrey St Unit 2
- 2 Wilfred Terrace
- 212 Humphrey St Unit 205
- 83 Lafayette St
- 9 Tedesco Pond Place Unit 9
- 436 Lafayette St
- 2 Martin St
- 11 Sumner Rd
- 6 Loring Hills Ave Unit D3
- 3 Oak St
- 3 Cedarcrest Rd
- 10 Quadrant Rd
- 37 Stanley Rd
- 48 Bellevue Rd
- 34 Lafayette St
- 30 Amherst Rd
- 1006 Paradise Rd Unit 3R
- 61 Leggs Hill Rd
- 3 Riverside Dr
- 12 Yorkshire Rd
- 62 Leggs Hill Rd
- 2 Riverside Dr
- 60 Leggs Hill Rd
- 60 Leggs Hill Rd
- 4 Riverside Dr
- 64 Leggs Hill Rd
- 8 Victoria Ln
- 10 Yorkshire Rd
- 58 Leggs Hill Rd Unit 1
- 67 Leggs Hill Rd
- 11 Yorkshire Rd
- 5 Riverside Dr
- 6 Victoria Ln
- 66 Leggs Hill Rd
- 9 Yorkshire Rd
- 18 Yorkshire Rd
- 6 Riverside Dr