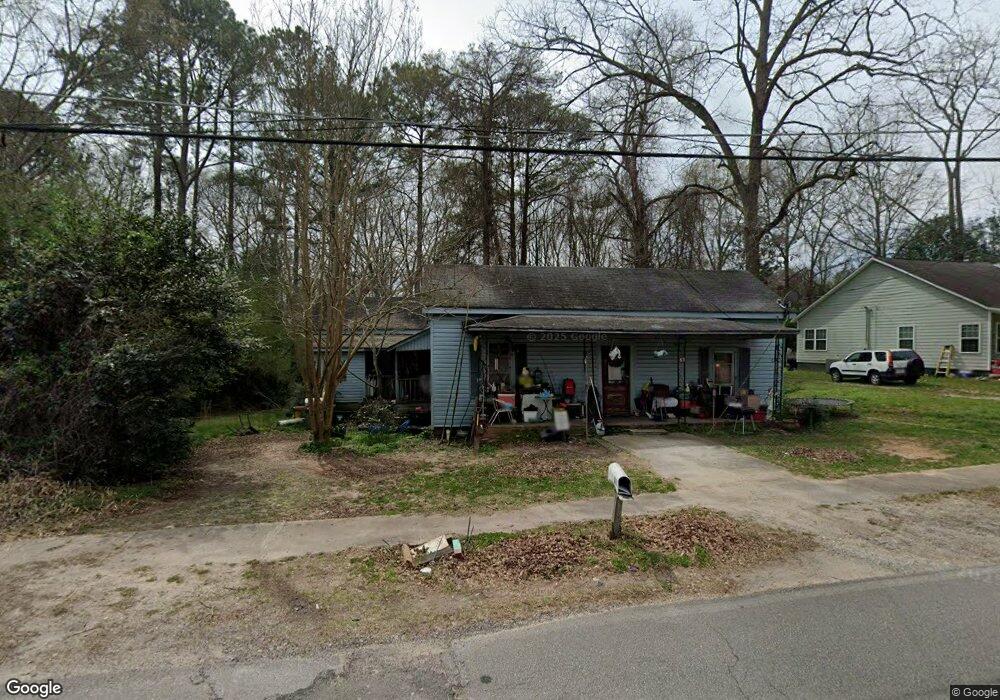
63 Lone Oak St Grantville, GA 30220
Estimated Value: $50,000 - $271,000
4
Beds
1
Bath
1,502
Sq Ft
$111/Sq Ft
Est. Value
About This Home
This home is located at 63 Lone Oak St, Grantville, GA 30220 and is currently estimated at $166,313, approximately $110 per square foot. 63 Lone Oak St is a home located in Coweta County with nearby schools including Glanton Elementary School, Smokey Road Middle School, and Newnan High School.
Ownership History
Date
Name
Owned For
Owner Type
Purchase Details
Closed on
Jan 7, 2023
Sold by
Cole Madison
Bought by
Cole James Daniel
Current Estimated Value
Purchase Details
Closed on
Mar 10, 2022
Sold by
Pmi Homes Inc
Bought by
Cole Madison Samantha
Purchase Details
Closed on
Feb 14, 2022
Sold by
Jac Real Estate Llc
Bought by
Dsc Property Management Llc
Purchase Details
Closed on
Sep 27, 2021
Sold by
Chester Michele B
Bought by
Jac Real Estate Llc
Purchase Details
Closed on
Apr 28, 2000
Sold by
Gentry Gentry J and Gentry Claudelina
Bought by
Chester Anthony S and Chester Michele B
Home Financials for this Owner
Home Financials are based on the most recent Mortgage that was taken out on this home.
Original Mortgage
$35,200
Interest Rate
8.28%
Mortgage Type
New Conventional
Purchase Details
Closed on
Jan 4, 1991
Bought by
Gentry Gentry J and Gentry Clau
Purchase Details
Closed on
Nov 9, 1989
Bought by
Smith Terry O
Create a Home Valuation Report for This Property
The Home Valuation Report is an in-depth analysis detailing your home's value as well as a comparison with similar homes in the area
Home Values in the Area
Average Home Value in this Area
Purchase History
| Date | Buyer | Sale Price | Title Company |
|---|---|---|---|
| Cole James Daniel | -- | -- | |
| Cole Madison Samantha | $33,000 | -- | |
| Pmi Homes Inc | $30,500 | -- | |
| Dsc Property Management Llc | -- | -- | |
| Jac Real Estate Llc | -- | -- | |
| Chester Anthony S | $44,000 | -- | |
| Gentry Gentry J | $24,000 | -- | |
| Smith Terry O | -- | -- |
Source: Public Records
Mortgage History
| Date | Status | Borrower | Loan Amount |
|---|---|---|---|
| Previous Owner | Chester Anthony S | $35,200 |
Source: Public Records
Tax History Compared to Growth
Tax History
| Year | Tax Paid | Tax Assessment Tax Assessment Total Assessment is a certain percentage of the fair market value that is determined by local assessors to be the total taxable value of land and additions on the property. | Land | Improvement |
|---|---|---|---|---|
| 2024 | $551 | $19,370 | $6,000 | $13,370 |
| 2023 | $551 | $16,660 | $6,000 | $10,660 |
| 2022 | $656 | $22,542 | $3,042 | $19,500 |
| 2021 | $637 | $19,946 | $3,042 | $16,904 |
| 2020 | $648 | $19,946 | $3,042 | $16,904 |
| 2019 | $537 | $14,887 | $6,070 | $8,817 |
| 2018 | $525 | $14,887 | $6,070 | $8,817 |
| 2017 | $588 | $16,651 | $6,070 | $10,581 |
| 2016 | $607 | $17,152 | $6,572 | $10,580 |
| 2015 | $319 | $10,260 | $4,382 | $5,878 |
| 2014 | $319 | $10,260 | $4,382 | $5,878 |
Source: Public Records
Map
Nearby Homes
- 108 Lone Oak St
- 110 Lone Oak St
- 0 Holtzclaw Rd Unit 10579214
- 142 Colley St
- 5710 Hwy 29
- 36 Reese St
- 0 Highway 0029 Unit 10619140
- 32 Chelsea Ln
- 161 Brasch Park Dr
- 267 Lagrange St
- 299 Lagrange St
- 309 Lagrange St
- 320 W Grantville Rd
- 74 Canterbury Dr
- 14 Huntington Dr
- 37 Canterbury Dr
- 73 Canterbury Dr
- 69 Canterbury Dr
- 93.49 ACRES Forrest Rd
- 106 Calico Loop