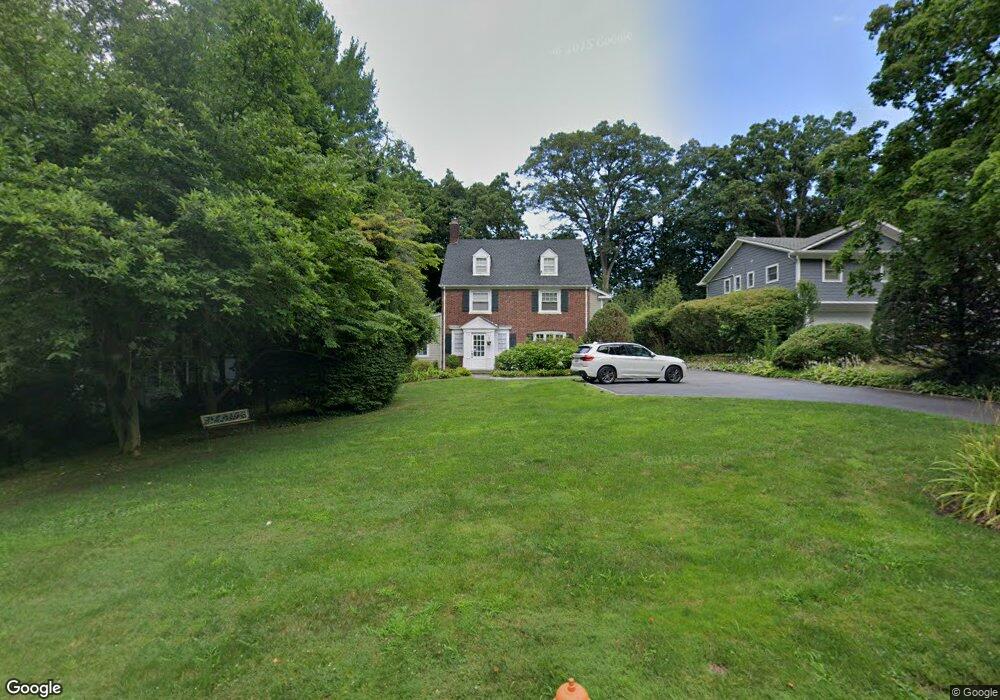
63 Longview Rd Port Washington, NY 11050
Estimated Value: $2,109,000 - $2,348,791
5
Beds
5
Baths
3,877
Sq Ft
$575/Sq Ft
Est. Value
About This Home
This home is located at 63 Longview Rd, Port Washington, NY 11050 and is currently estimated at $2,228,896, approximately $574 per square foot. 63 Longview Rd is a home located in Nassau County with nearby schools including John J. Daly Elementary School, Carrie Palmer Weber Middle School, and Paul D. Schreiber Senior High School.
Ownership History
Date
Name
Owned For
Owner Type
Purchase Details
Closed on
Jul 8, 2021
Sold by
Conway Timothy J and Conway Lisa M
Bought by
Bagchi Sabari and Makhijani Sunil
Current Estimated Value
Home Financials for this Owner
Home Financials are based on the most recent Mortgage that was taken out on this home.
Original Mortgage
$1,253,000
Outstanding Balance
$1,135,495
Interest Rate
2.96%
Mortgage Type
New Conventional
Estimated Equity
$1,093,401
Purchase Details
Closed on
Jun 29, 1999
Sold by
Vilgertshofer Erich M and Vilgertshofer Dolores
Bought by
Conway Timothy J and Conway Lisa M
Home Financials for this Owner
Home Financials are based on the most recent Mortgage that was taken out on this home.
Original Mortgage
$225,000
Interest Rate
6%
Mortgage Type
Stand Alone Second
Create a Home Valuation Report for This Property
The Home Valuation Report is an in-depth analysis detailing your home's value as well as a comparison with similar homes in the area
Home Values in the Area
Average Home Value in this Area
Purchase History
| Date | Buyer | Sale Price | Title Company |
|---|---|---|---|
| Bagchi Sabari | $1,790,000 | None Available | |
| Bagchi Sabari | $1,790,000 | None Available | |
| Bagchi Sabari | $1,790,000 | None Available | |
| Conway Timothy J | $650,000 | -- | |
| Conway Timothy J | $650,000 | -- | |
| Conway Timothy J | $650,000 | -- |
Source: Public Records
Mortgage History
| Date | Status | Borrower | Loan Amount |
|---|---|---|---|
| Open | Bagchi Sabari | $1,253,000 | |
| Closed | Bagchi Sabari | $1,253,000 | |
| Previous Owner | Conway Timothy J | $225,000 | |
| Previous Owner | Conway Timothy J | $305,000 |
Source: Public Records
Tax History Compared to Growth
Tax History
| Year | Tax Paid | Tax Assessment Tax Assessment Total Assessment is a certain percentage of the fair market value that is determined by local assessors to be the total taxable value of land and additions on the property. | Land | Improvement |
|---|---|---|---|---|
| 2025 | $32,390 | $1,382 | $586 | $796 |
| 2024 | $10,200 | $1,432 | $607 | $825 |
| 2023 | $32,929 | $1,530 | $648 | $882 |
| 2022 | $32,929 | $1,638 | $694 | $944 |
| 2021 | $34,720 | $1,600 | $634 | $966 |
| 2020 | $34,248 | $2,660 | $1,699 | $961 |
| 2019 | $36,331 | $3,026 | $1,933 | $1,093 |
| 2018 | $36,331 | $3,026 | $0 | $0 |
| 2017 | $22,227 | $3,026 | $1,933 | $1,093 |
| 2016 | $34,450 | $3,026 | $1,933 | $1,093 |
| 2015 | $11,904 | $3,026 | $1,800 | $1,226 |
| 2014 | $11,904 | $3,026 | $1,800 | $1,226 |
| 2013 | $8,415 | $2,272 | $1,933 | $339 |
Source: Public Records
Map
Nearby Homes
- 1 Hillcrest Rd
- 57 Beacon Hill Rd
- 11 Middle Rd
- 6 Jeannette Dr
- 39 Annette Dr
- 13 Linda Rd
- 22 N Maryland Ave
- 25 Wood Rd
- 32 Herbert Ave
- 262 Harbor Acres Rd
- 46 Hillview Ave
- 34 Hillview Ave
- 57 Sandy Hollow Rd
- 35 Evergreen Ave
- 11 Park Ave
- 125 Main St Unit 1T
- 125 Main St Unit 2H
- 70 Highland Ave
- 108 Highland Ave
- 22 Franklin Ave