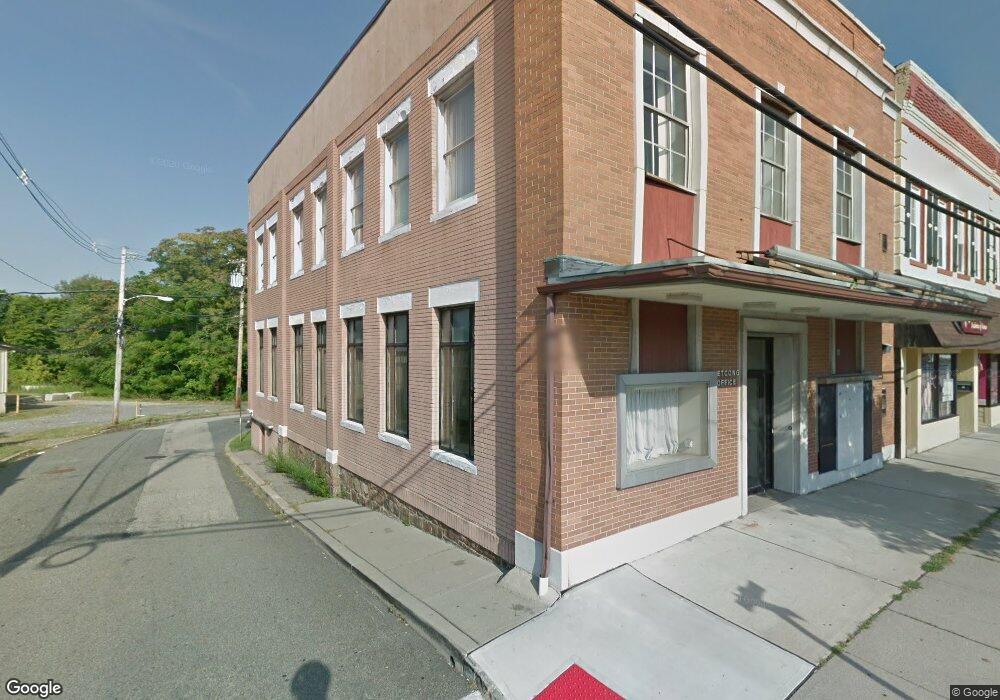
63 Main St Unit 1 Netcong, NJ 07857
Estimated Value: $420,736
Studio
--
Bath
5,400
Sq Ft
$78/Sq Ft
Est. Value
About This Home
This home is located at 63 Main St Unit 1, Netcong, NJ 07857 and is currently estimated at $420,736, approximately $77 per square foot. 63 Main St Unit 1 is a home located in Morris County with nearby schools including Netcong Elementary School and Lenape Val Regional High School.
Ownership History
Date
Name
Owned For
Owner Type
Purchase Details
Closed on
Oct 21, 2024
Sold by
Sts Property Investments Llc
Bought by
Leafsmart Llc
Current Estimated Value
Home Financials for this Owner
Home Financials are based on the most recent Mortgage that was taken out on this home.
Original Mortgage
$296,000
Interest Rate
6.72%
Mortgage Type
New Conventional
Purchase Details
Closed on
Aug 10, 2021
Sold by
63 Main St Llc
Bought by
Sts Property Investments Llc
Purchase Details
Closed on
Mar 23, 2007
Sold by
First States Investors 3107 Llc
Bought by
63 Main St Llc
Purchase Details
Closed on
May 24, 2005
Sold by
Wachovia Bank National Asssoc
Bought by
1St States Investors 3107 Llc
Create a Home Valuation Report for This Property
The Home Valuation Report is an in-depth analysis detailing your home's value as well as a comparison with similar homes in the area
Home Values in the Area
Average Home Value in this Area
Purchase History
| Date | Buyer | Sale Price | Title Company |
|---|---|---|---|
| Leafsmart Llc | $395,000 | First American Title | |
| Leafsmart Llc | $395,000 | First American Title | |
| Sts Property Investments Llc | $262,500 | Noble Title Agency Inc | |
| 63 Main St Llc | $550,000 | None Available | |
| 1St States Investors 3107 Llc | $705,000 | -- |
Source: Public Records
Mortgage History
| Date | Status | Borrower | Loan Amount |
|---|---|---|---|
| Previous Owner | Leafsmart Llc | $296,000 |
Source: Public Records
Tax History
| Year | Tax Paid | Tax Assessment Tax Assessment Total Assessment is a certain percentage of the fair market value that is determined by local assessors to be the total taxable value of land and additions on the property. | Land | Improvement |
|---|---|---|---|---|
| 2025 | $11,569 | $328,000 | $172,500 | $155,500 |
| 2024 | $11,667 | $328,000 | $172,500 | $155,500 |
Source: Public Records
Map
Nearby Homes
- 74 Main St
- 79 Main St
- 16-18 King St
- 35 Hillside Ave
- 60 Stoll St Unit 9
- 4 Elizabeth Ave
- 64 Spino Dr
- 9 Spino Dr
- 58 Brooklyn Rd
- 7 Walton Place
- 2 Roberts Place
- 8 Spencer St
- 8 Hillside Ave
- 0 Lawrence Ave
- 329 Alpine Ct Unit 29
- 71 U S Highway 206
- 573 Dell Place Unit 73
- 0 Swayze Pl Lawrence Ave
- 579 Dell Place Unit 79
- 3 Peckwell St
Your Personal Tour Guide
Ask me questions while you tour the home.