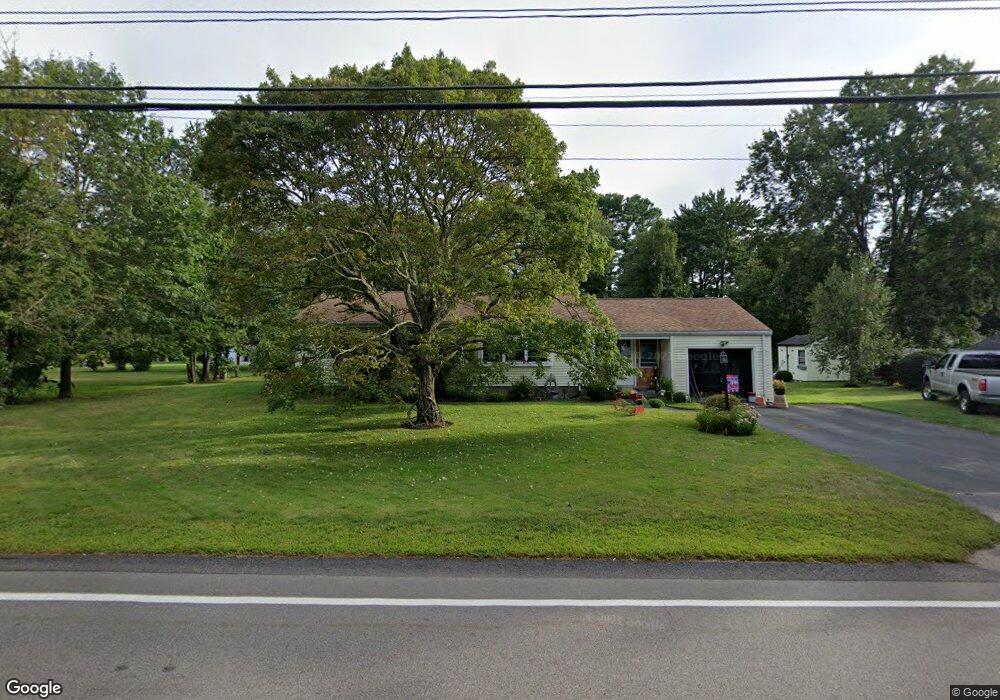
63 Main St Norfolk, MA 02056
Estimated Value: $544,718 - $645,000
3
Beds
2
Baths
1,260
Sq Ft
$481/Sq Ft
Est. Value
About This Home
This home is located at 63 Main St, Norfolk, MA 02056 and is currently estimated at $606,680, approximately $481 per square foot. 63 Main St is a home located in Norfolk County with nearby schools including H. Olive Day School, Freeman-Kennedy School, and Woodside Montessori Academy.
Ownership History
Date
Name
Owned For
Owner Type
Purchase Details
Closed on
Jan 23, 1989
Sold by
Giampa Linda M
Bought by
Smith Wayne L
Current Estimated Value
Home Financials for this Owner
Home Financials are based on the most recent Mortgage that was taken out on this home.
Original Mortgage
$121,200
Interest Rate
10.38%
Mortgage Type
Purchase Money Mortgage
Create a Home Valuation Report for This Property
The Home Valuation Report is an in-depth analysis detailing your home's value as well as a comparison with similar homes in the area
Home Values in the Area
Average Home Value in this Area
Purchase History
| Date | Buyer | Sale Price | Title Company |
|---|---|---|---|
| Smith Wayne L | $151,500 | -- |
Source: Public Records
Mortgage History
| Date | Status | Borrower | Loan Amount |
|---|---|---|---|
| Open | Smith Wayne L | $123,750 | |
| Closed | Smith Wayne L | $121,200 |
Source: Public Records
Tax History Compared to Growth
Tax History
| Year | Tax Paid | Tax Assessment Tax Assessment Total Assessment is a certain percentage of the fair market value that is determined by local assessors to be the total taxable value of land and additions on the property. | Land | Improvement |
|---|---|---|---|---|
| 2025 | $7,407 | $463,800 | $199,700 | $264,100 |
| 2024 | $7,351 | $472,100 | $211,000 | $261,100 |
| 2023 | $6,771 | $412,600 | $201,500 | $211,100 |
| 2022 | $6,801 | $373,700 | $186,800 | $186,900 |
| 2021 | $6,448 | $358,400 | $164,300 | $194,100 |
| 2020 | $5,969 | $320,200 | $157,200 | $163,000 |
| 2019 | $5,589 | $305,600 | $157,200 | $148,400 |
| 2018 | $4,998 | $268,400 | $144,700 | $123,700 |
| 2017 | $4,927 | $270,400 | $144,700 | $125,700 |
| 2016 | $4,806 | $265,800 | $141,500 | $124,300 |
| 2015 | $4,542 | $257,200 | $134,700 | $122,500 |
| 2014 | $4,513 | $258,900 | $134,700 | $124,200 |
Source: Public Records
Map
Nearby Homes
- 8 Boyde's Crossing
- 8 Boyde's Crossing Unit 4
- 118 Main St
- 3 Elliot Mills Unit 3
- 6 Elliot Mills Unit 6
- 7 Malcolm St
- 45 Meetinghouse Rd Unit 45
- 12 Brookside Ln
- 10 Medway St
- 37 Thomas Mann Cir Unit 23
- 27 Thomas Mann Cir Unit 18
- 51 Thomas Mann Unit 30
- 28 Thomas Mann Cir Unit Lot 38
- 7 Keeney Pond Rd
- 53 Thomas Mann Cir Unit 31
- 57 Thomas Mann Cir Unit 57
- 16 Keeney Pond Rd
- 63 Thomas Mann Cir Unit 36
- The Georgetown L Plan at Lakeland Hills
- The Georgetown Grand L Plan at Lakeland Hills