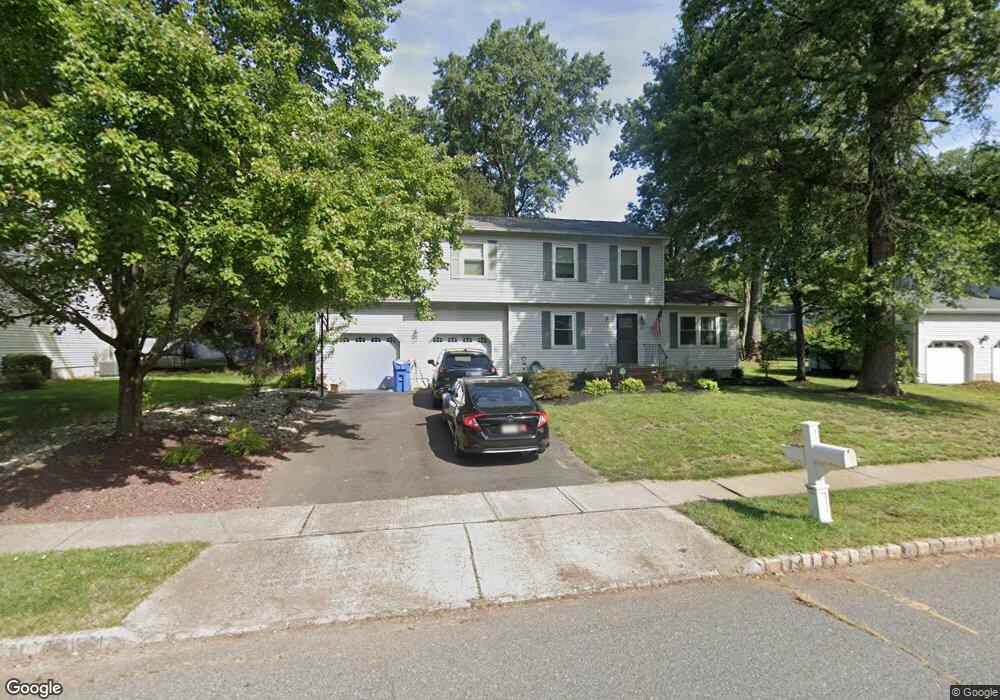
63 Marshall Rd Hillsborough, NJ 08844
Estimated Value: $621,000 - $707,000
--
Bed
--
Bath
1,551
Sq Ft
$428/Sq Ft
Est. Value
About This Home
This home is located at 63 Marshall Rd, Hillsborough, NJ 08844 and is currently estimated at $663,149, approximately $427 per square foot. 63 Marshall Rd is a home located in Somerset County with nearby schools including Hillsborough High School, Brighthorizons at Hillsborough, and Cherry Blossom Montessori School.
Ownership History
Date
Name
Owned For
Owner Type
Purchase Details
Closed on
Jun 29, 2007
Sold by
Vanmanen Scott and Van Manen Karen
Bought by
Mindish Keith and Mindish Kathy
Current Estimated Value
Home Financials for this Owner
Home Financials are based on the most recent Mortgage that was taken out on this home.
Original Mortgage
$110,625
Outstanding Balance
$89,919
Interest Rate
6.39%
Mortgage Type
Credit Line Revolving
Estimated Equity
$573,230
Purchase Details
Closed on
Jun 14, 2001
Sold by
Dawson Barrpm
Bought by
Vanmanen Scott and Van Manen Karen
Home Financials for this Owner
Home Financials are based on the most recent Mortgage that was taken out on this home.
Original Mortgage
$247,000
Interest Rate
7.09%
Purchase Details
Closed on
Jun 10, 1993
Sold by
Fairview Enterprises
Bought by
Dawson Barrie and Dawson Bonnie
Purchase Details
Closed on
Jan 4, 1993
Sold by
Fairview Enterprises
Bought by
Dawson Barron and Dawson Bonita
Create a Home Valuation Report for This Property
The Home Valuation Report is an in-depth analysis detailing your home's value as well as a comparison with similar homes in the area
Home Values in the Area
Average Home Value in this Area
Purchase History
| Date | Buyer | Sale Price | Title Company |
|---|---|---|---|
| Mindish Keith | $442,500 | Fidelity Natl Title Ins Co | |
| Vanmanen Scott | $275,000 | -- | |
| Dawson Barrie | $192,500 | -- | |
| Dawson Barron | $192,000 | -- |
Source: Public Records
Mortgage History
| Date | Status | Borrower | Loan Amount |
|---|---|---|---|
| Open | Mindish Keith | $110,625 | |
| Previous Owner | Vanmanen Scott | $247,000 |
Source: Public Records
Tax History Compared to Growth
Tax History
| Year | Tax Paid | Tax Assessment Tax Assessment Total Assessment is a certain percentage of the fair market value that is determined by local assessors to be the total taxable value of land and additions on the property. | Land | Improvement |
|---|---|---|---|---|
| 2025 | $12,339 | $622,200 | $386,200 | $236,000 |
| 2024 | $12,339 | $575,800 | $371,200 | $204,600 |
| 2023 | $11,129 | $516,900 | $311,200 | $205,700 |
| 2022 | $10,852 | $486,000 | $306,200 | $179,800 |
| 2021 | $10,143 | $432,000 | $251,200 | $180,800 |
| 2020 | $9,972 | $418,300 | $246,200 | $172,100 |
| 2019 | $9,840 | $409,300 | $236,200 | $173,100 |
| 2018 | $9,354 | $386,700 | $211,200 | $175,500 |
| 2017 | $9,271 | $383,900 | $206,200 | $177,700 |
| 2016 | $9,277 | $384,300 | $205,600 | $178,700 |
| 2015 | $8,828 | $370,300 | $190,600 | $179,700 |
| 2014 | $8,545 | $366,100 | $175,600 | $190,500 |
Source: Public Records
Map
Nearby Homes
- 7 Monfort Dr
- 195 Beekman Ln
- 710 Whitenack Ct
- 912 Merritt Dr Unit D
- 902 Merritt Dr Unit E
- 104 Devonshire Ct
- 911 Merritt Dr Unit B2
- 303 Gemini Dr Unit 2B
- 807 Eves Dr Unit 1B
- 118 Bluebird Dr Unit 3
- 806 Eves Dr Unit 1B
- 911 Renate Dr Unit 1
- 790 Eves Dr
- 3120 Revere Ct
- 3204 Revere Ct
- 107 Bluebird Dr Unit 1D
- 3011 Revere Ct
- 3014 Revere Ct
- 3007 Revere Ct
- 61 Wallace Blvd