63 Maxim Dr Forked River, NJ 08731
Estimated Value: $700,173 - $868,000
About This Home
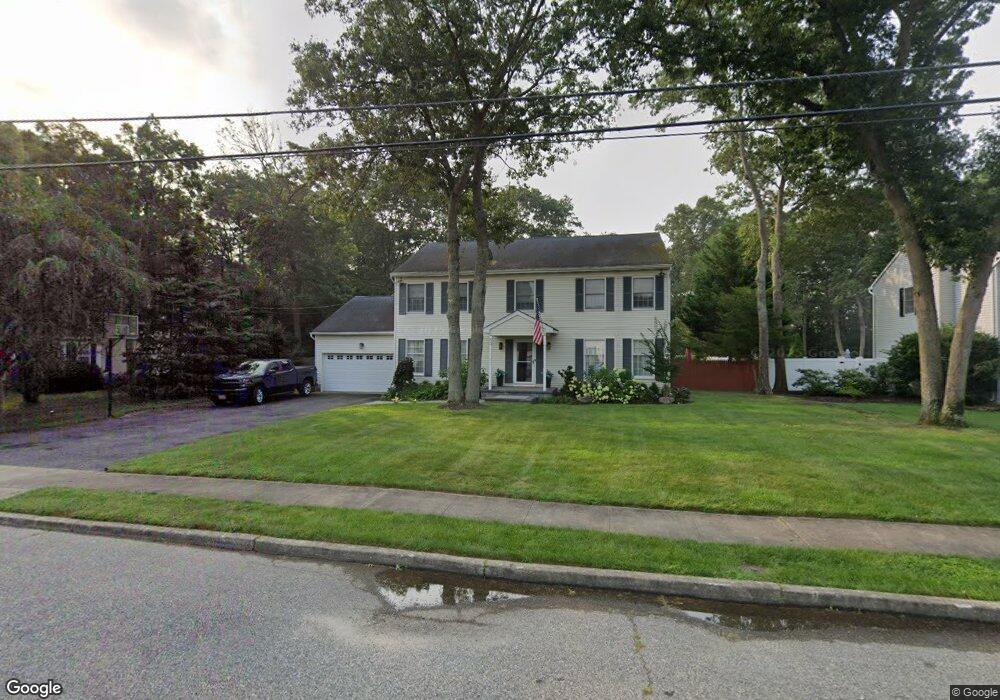
This home is located at 63 Maxim Dr, Forked River, NJ 08731 and is currently estimated at $774,793, approximately $246 per square foot. 63 Maxim Dr is a home located in Ocean County with nearby schools including Lacey Township High School.
Ownership History
We collect this data history from publicly available records. To have your information removed, we recommend requesting removal directly through your county’s website.
Purchase Details
Home Financials for this Owner
Home Financials are based on the most recent Mortgage that was taken out on this home.Purchase Details
Home Financials for this Owner
Home Financials are based on the most recent Mortgage that was taken out on this home.Home Values in the Area
Average Home Value in this Area
Purchase History
We collect this data history from publicly available records. To have your information removed, we recommend requesting removal directly through your county’s website.
| Date | Buyer | Sale Price | Title Company |
|---|---|---|---|
| $250,000 | -- | ||
| $219,000 | -- |
Mortgage History
We collect this data history from publicly available records. To have your information removed, we recommend requesting removal directly through your county’s website.
| Date | Status | Borrower | Loan Amount |
|---|---|---|---|
| Open | $80,000 | ||
| Previous Owner | $130,000 |
Tax History
We collect this data history from publicly available records. To have your information removed, we recommend requesting removal directly through your county’s website.
| Year | Tax Paid | Tax Assessment Tax Assessment Total Assessment is a certain percentage of the fair market value that is determined by local assessors to be the total taxable value of land and additions on the property. | Land | Improvement |
|---|---|---|---|---|
| 2025 | $11,449 | $418,600 | $123,500 | $295,100 |
| 2024 | $9,917 | $418,600 | $123,500 | $295,100 |
| 2023 | $9,473 | $418,600 | $123,500 | $295,100 |
| 2022 | $9,473 | $418,600 | $123,500 | $295,100 |
| 2021 | $9,314 | $418,600 | $123,500 | $295,100 |
| 2020 | $9,017 | $418,600 | $123,500 | $295,100 |
| 2019 | $8,858 | $418,600 | $123,500 | $295,100 |
| 2018 | $8,753 | $418,600 | $123,500 | $295,100 |
| 2017 | $8,552 | $418,600 | $123,500 | $295,100 |
| 2016 | $8,519 | $418,600 | $123,500 | $295,100 |
| 2015 | $8,138 | $418,600 | $123,500 | $295,100 |
| 2014 | $7,353 | $427,500 | $133,500 | $294,000 |
Map
- 79 Maxim Dr
- 37 Manchester Ave
- 535 Holmes Ave N
- 510 Oak Hill Ct
- 137 Heatherington Ct
- 653 Elwood St
- 1030 Elwood St
- 743 Devon St
- 208 Quail Ln S
- 808 Tappan St
- 411 Brentwood Place
- 49 Haines St
- 553 Vaughn Ave
- 000 Elwood St
- 443 Stoney Point Dr
- 931 Kearny Ave
- 231 Eagleswood Ave
- 0 Newark Ave
- 9 Arborridge Dr
- 27 Penn Place
Ask me questions while you tour the home.