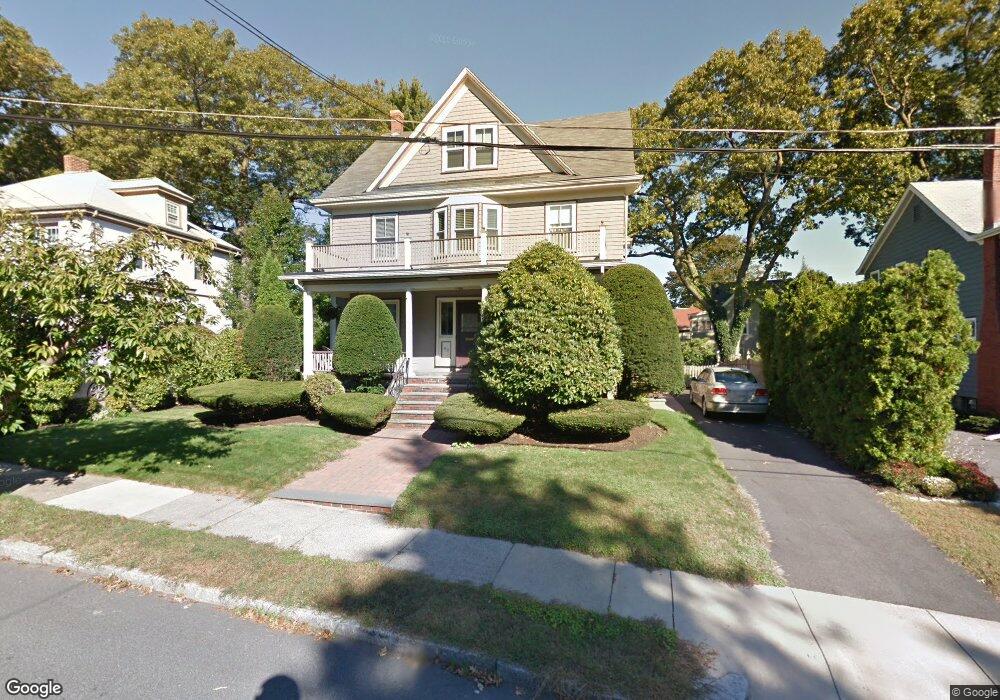
63 Morgan St Melrose, MA 02176
Melrose Highlands NeighborhoodEstimated Value: $819,323 - $1,296,000
4
Beds
3
Baths
3,055
Sq Ft
$353/Sq Ft
Est. Value
About This Home
This home is located at 63 Morgan St, Melrose, MA 02176 and is currently estimated at $1,079,581, approximately $353 per square foot. 63 Morgan St is a home located in Middlesex County with nearby schools including Wakefield Memorial High School, Melrose Montessori School, and St Mary's School.
Ownership History
Date
Name
Owned For
Owner Type
Purchase Details
Closed on
Mar 13, 1998
Sold by
Glines George A and Glines Ann L
Bought by
Anderson Stephen and Anderson Deborah W
Current Estimated Value
Home Financials for this Owner
Home Financials are based on the most recent Mortgage that was taken out on this home.
Original Mortgage
$150,000
Interest Rate
7.03%
Mortgage Type
Purchase Money Mortgage
Create a Home Valuation Report for This Property
The Home Valuation Report is an in-depth analysis detailing your home's value as well as a comparison with similar homes in the area
Home Values in the Area
Average Home Value in this Area
Purchase History
| Date | Buyer | Sale Price | Title Company |
|---|---|---|---|
| Anderson Stephen | $320,000 | -- |
Source: Public Records
Mortgage History
| Date | Status | Borrower | Loan Amount |
|---|---|---|---|
| Open | Anderson Stephen | $175,000 | |
| Open | Anderson Stephen | $280,000 | |
| Closed | Anderson Stephen | $150,000 | |
| Previous Owner | Anderson Stephen | $80,000 |
Source: Public Records
Tax History
| Year | Tax Paid | Tax Assessment Tax Assessment Total Assessment is a certain percentage of the fair market value that is determined by local assessors to be the total taxable value of land and additions on the property. | Land | Improvement |
|---|---|---|---|---|
| 2025 | $36 | $363,600 | $149,300 | $214,300 |
| 2024 | $3,611 | $363,600 | $149,300 | $214,300 |
| 2023 | $3,419 | $328,100 | $133,200 | $194,900 |
| 2022 | $3,311 | $313,200 | $125,100 | $188,100 |
| 2021 | $3,138 | $286,600 | $113,000 | $173,600 |
| 2020 | $3,159 | $285,900 | $113,000 | $172,900 |
| 2019 | $2,827 | $261,500 | $102,100 | $159,400 |
| 2018 | $2,857 | $252,200 | $92,800 | $159,400 |
| 2017 | $2,795 | $236,900 | $88,800 | $148,100 |
| 2016 | $2,735 | $221,800 | $84,700 | $137,100 |
| 2015 | $2,535 | $195,600 | $80,700 | $114,900 |
| 2014 | $2,544 | $191,600 | $76,700 | $114,900 |
Source: Public Records
Map
Nearby Homes
- 34-36 W Highland Ave
- 23 Ellsworth Ave
- 24 Ellsworth Ave
- 601 Franklin St Unit 2
- 60 Franklin St Unit 60
- 58 Franklin St Unit 58
- 98 Boardman Ave
- 43-51 Albion St Unit C9
- 51 Melrose St Unit 1C
- 51 Melrose St Unit 1A
- 7 West St
- 49 Melrose St Unit 1F
- 9 Ledge St
- 176 Bay State Rd
- 24 Mount Zion Rd
- 11 Ludlow Ave
- 35 Maple Rd
- 8 Crystal St Unit 2
- 8 Crystal St Unit 3
- 12 Lovis Ave
Your Personal Tour Guide
Ask me questions while you tour the home.