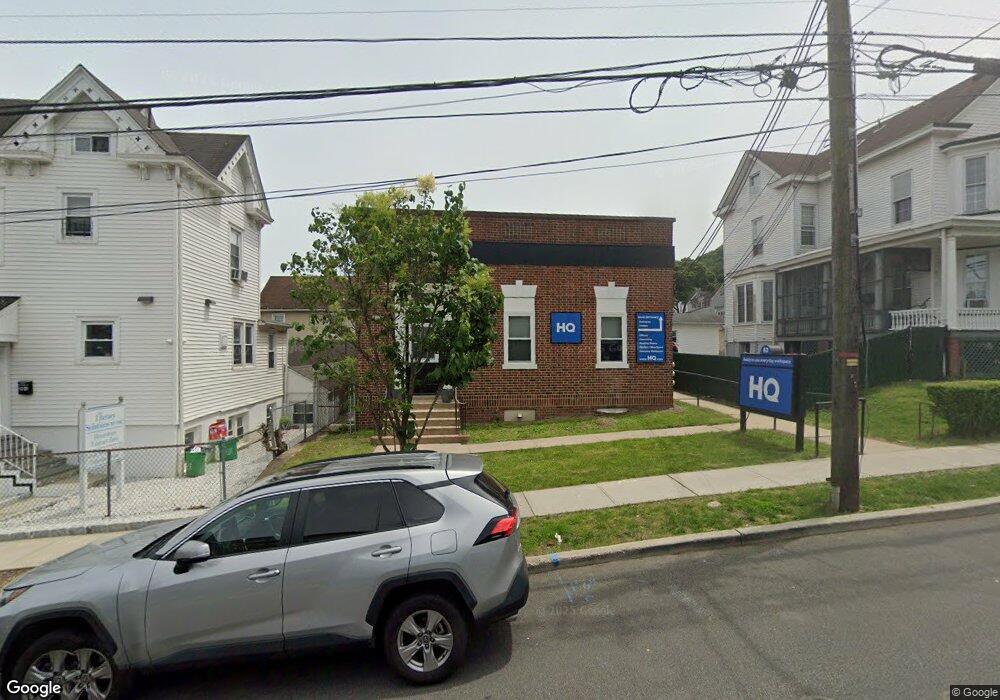
63 New Main St Unit 310 Haverstraw, NY 10927
Estimated Value: $589,858
Studio
--
Bath
2,304
Sq Ft
$256/Sq Ft
Est. Value
About This Home
This home is located at 63 New Main St Unit 310, Haverstraw, NY 10927 and is currently estimated at $589,858, approximately $256 per square foot. 63 New Main St Unit 310 is a home located in Rockland County with nearby schools including Haverstraw Elementary School, West Haverstraw Elementary School, and Fieldstone Secondary School.
Ownership History
Date
Name
Owned For
Owner Type
Purchase Details
Closed on
Apr 21, 2023
Sold by
Apel Feigy
Bought by
Spl Realty Group Llc
Current Estimated Value
Purchase Details
Closed on
Dec 29, 2021
Sold by
Habib American Bank
Bought by
Apel Feigy
Purchase Details
Closed on
Apr 14, 2021
Sold by
Amalfitano Gerard
Bought by
Habib American Bank
Purchase Details
Closed on
Mar 23, 2017
Sold by
P & E Management Group Corp
Bought by
63 New Main Street Inc
Purchase Details
Closed on
Mar 6, 2017
Sold by
Klein Jehiel
Bought by
P & E Management Group Corp
Purchase Details
Closed on
Dec 24, 2013
Sold by
Six Kays Llc
Bought by
Klein Jehiel
Purchase Details
Closed on
Feb 10, 2004
Sold by
63 New Main Street Realty Associates Llc
Bought by
Six Kays Llc
Purchase Details
Closed on
Nov 12, 1997
Sold by
Ramos Julianne
Bought by
63 New Main St Realty Associates Llc
Create a Home Valuation Report for This Property
The Home Valuation Report is an in-depth analysis detailing your home's value as well as a comparison with similar homes in the area
Home Values in the Area
Average Home Value in this Area
Purchase History
| Date | Buyer | Sale Price | Title Company |
|---|---|---|---|
| Spl Realty Group Llc | $462,470 | None Available | |
| Apel Feigy | $450,000 | None Available | |
| Habib American Bank | $720,042 | None Available | |
| 63 New Main Street Inc | $750,000 | None Available | |
| P & E Management Group Corp | -- | None Available | |
| Klein Jehiel | $200,000 | Fidelity National Title Insu | |
| Six Kays Llc | $330,000 | -- | |
| 63 New Main St Realty Associates Llc | -- | -- |
Source: Public Records
Tax History
| Year | Tax Paid | Tax Assessment Tax Assessment Total Assessment is a certain percentage of the fair market value that is determined by local assessors to be the total taxable value of land and additions on the property. | Land | Improvement |
|---|---|---|---|---|
| 2024 | $86,842 | $300,000 | $62,100 | $237,900 |
| 2023 | $86,842 | $300,000 | $62,100 | $237,900 |
| 2022 | $82,478 | $300,000 | $62,100 | $237,900 |
| 2021 | $78,710 | $300,000 | $62,100 | $237,900 |
| 2020 | $26,025 | $300,000 | $62,100 | $237,900 |
| 2019 | $8,346 | $300,000 | $62,100 | $237,900 |
| 2018 | $25,920 | $300,000 | $62,100 | $237,900 |
| 2017 | $24,621 | $300,000 | $62,100 | $237,900 |
| 2016 | $42,309 | $300,000 | $62,100 | $237,900 |
| 2015 | -- | $300,000 | $62,100 | $237,900 |
| 2014 | -- | $300,000 | $62,100 | $237,900 |
Source: Public Records
Map
Nearby Homes
- 55 New Main St
- 90 Conklin Ave
- 27 Conger Ave
- 7 Conger Ave
- 54 Hudson Ave
- 9 Hillside Ave
- 79 Clove Ave
- 66 Broadway
- 10 Jefferson St
- 37 Conklin Ave
- 41 Third St
- 27 Warren Ave
- 20 Pratt St
- 50 Westside Ave
- 5 Pratt St
- 9 Simenovsky Dr
- 84 Village Mill Unit 84
- 1414 Round Pointe Dr Unit 1414
- 1207 Round Pointe Dr
- 1308 Round Pointe Dr Unit 1308
- 63 New Main St Unit 1st Floor
- 63 New Main St Unit 2nd Floor
- 63 New Main St Unit Top Rear
- 63 New Main St Unit Top Front
- 63 New Main St Unit Lower Front
- 63 New Main St Unit 330
- 63 New Main St
- 67 New Main St
- 69 New Main St
- 24 Clove Ave
- 61 New Main St
- 61 New Main St Unit 201 mid level
- 61 New Main St Unit 101
- 26 Clove Ave
- 69 New Main St
- 71 New Main St
- 30 Clove Ave
- 57 New Main St
- 60 New Main St
- 32 Clove Ave
Your Personal Tour Guide
Ask me questions while you tour the home.