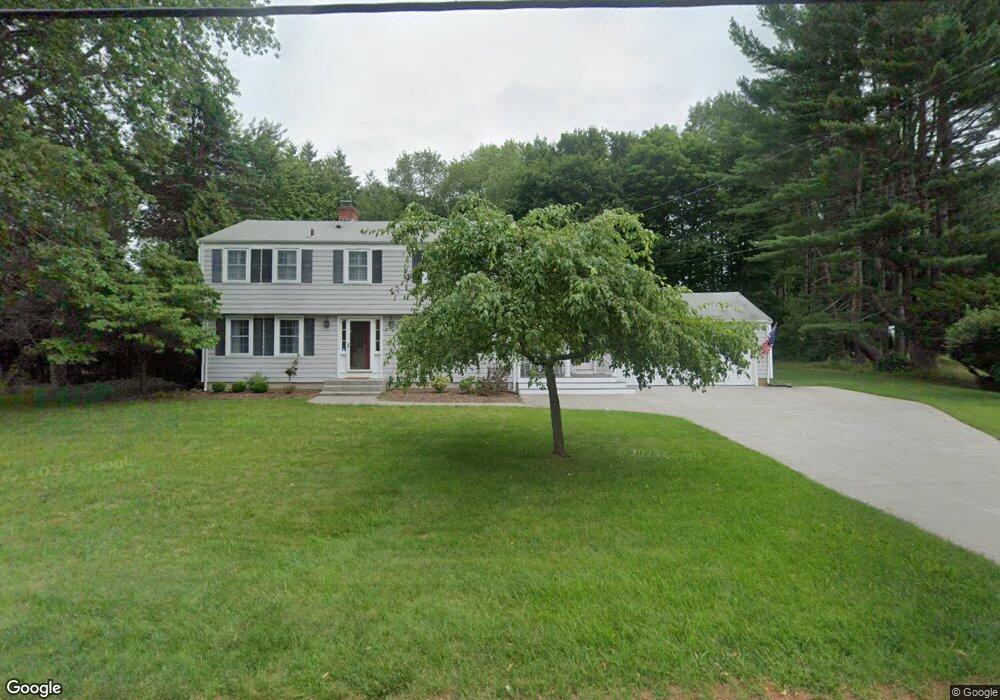
63 New Meadow Rd Barrington, RI 02806
Hampden Meadows NeighborhoodEstimated Value: $1,010,233 - $1,434,000
4
Beds
3
Baths
2,910
Sq Ft
$401/Sq Ft
Est. Value
About This Home
This home is located at 63 New Meadow Rd, Barrington, RI 02806 and is currently estimated at $1,167,808, approximately $401 per square foot. 63 New Meadow Rd is a home located in Bristol County with nearby schools including Barrington High School, St. Andrews School, and East Bay Career Academy.
Ownership History
Date
Name
Owned For
Owner Type
Purchase Details
Closed on
Aug 27, 2001
Sold by
Spitale Roberto and Spitale Alida
Bought by
Carusi Dominic L and Carusi Dawn
Current Estimated Value
Purchase Details
Closed on
Dec 29, 1998
Sold by
Hornaday Ann P
Bought by
Spitale Roberto and Spitale Alida
Purchase Details
Closed on
Aug 21, 1997
Sold by
Carrick Chase W and Carrick Gerald
Bought by
Hornaday Ann P
Create a Home Valuation Report for This Property
The Home Valuation Report is an in-depth analysis detailing your home's value as well as a comparison with similar homes in the area
Home Values in the Area
Average Home Value in this Area
Purchase History
| Date | Buyer | Sale Price | Title Company |
|---|---|---|---|
| Carusi Dominic L | $375,000 | -- | |
| Spitale Roberto | $260,000 | -- | |
| Hornaday Ann P | $246,000 | -- |
Source: Public Records
Mortgage History
| Date | Status | Borrower | Loan Amount |
|---|---|---|---|
| Open | Hornaday Ann P | $261,000 | |
| Closed | Hornaday Ann P | $266,000 | |
| Closed | Hornaday Ann P | $70,000 |
Source: Public Records
Tax History Compared to Growth
Tax History
| Year | Tax Paid | Tax Assessment Tax Assessment Total Assessment is a certain percentage of the fair market value that is determined by local assessors to be the total taxable value of land and additions on the property. | Land | Improvement |
|---|---|---|---|---|
| 2025 | $11,566 | $754,000 | $347,000 | $407,000 |
| 2024 | $11,122 | $754,000 | $347,000 | $407,000 |
| 2023 | $10,658 | $525,000 | $222,000 | $303,000 |
| 2022 | $10,316 | $525,000 | $222,000 | $303,000 |
| 2021 | $10,054 | $525,000 | $222,000 | $303,000 |
| 2020 | $9,907 | $474,000 | $192,000 | $282,000 |
| 2019 | $9,527 | $474,000 | $192,000 | $282,000 |
| 2018 | $9,243 | $474,000 | $192,000 | $282,000 |
| 2017 | $9,348 | $467,400 | $190,100 | $277,300 |
| 2016 | $8,624 | $467,400 | $190,100 | $277,300 |
| 2015 | $8,530 | $467,400 | $190,100 | $277,300 |
| 2014 | $9,256 | $505,800 | $277,600 | $228,200 |
Source: Public Records
Map
Nearby Homes