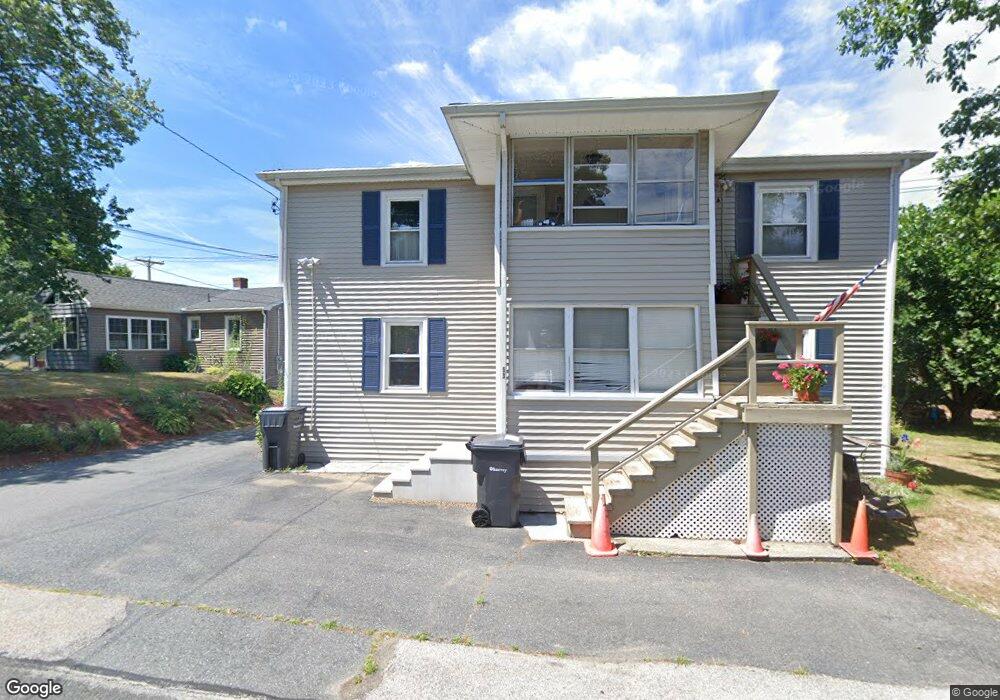
63 Oak St Grafton, MA 01519
Estimated Value: $355,000 - $643,000
4
Beds
2
Baths
2,262
Sq Ft
$229/Sq Ft
Est. Value
About This Home
This home is located at 63 Oak St, Grafton, MA 01519 and is currently estimated at $517,425, approximately $228 per square foot. 63 Oak St is a home located in Worcester County with nearby schools including Grafton High School, Silver Spruce Montessori School, and Touchstone Community School.
Ownership History
Date
Name
Owned For
Owner Type
Purchase Details
Closed on
Nov 5, 2019
Sold by
Barbara Noel Ret
Bought by
218 Worcester Street Llc
Current Estimated Value
Home Financials for this Owner
Home Financials are based on the most recent Mortgage that was taken out on this home.
Original Mortgage
$210,000
Outstanding Balance
$185,112
Interest Rate
3.7%
Mortgage Type
New Conventional
Estimated Equity
$332,313
Purchase Details
Closed on
Jul 14, 2017
Sold by
Noel Barbara J
Bought by
Barbara Noel Ret and Noel
Purchase Details
Closed on
Jan 23, 1973
Bought by
Noel Francis M and Noel Barbara J
Create a Home Valuation Report for This Property
The Home Valuation Report is an in-depth analysis detailing your home's value as well as a comparison with similar homes in the area
Home Values in the Area
Average Home Value in this Area
Purchase History
| Date | Buyer | Sale Price | Title Company |
|---|---|---|---|
| 218 Worcester Street Llc | $250,000 | Metropolitan Title Agency | |
| Barbara Noel Ret | -- | -- | |
| Barbara Noel Ret | -- | -- | |
| Barbara Noel Ret | -- | -- | |
| Noel Francis M | -- | -- |
Source: Public Records
Mortgage History
| Date | Status | Borrower | Loan Amount |
|---|---|---|---|
| Open | 218 Worcester Street Llc | $210,000 | |
| Closed | 218 Worcester Street Llc | $210,000 |
Source: Public Records
Tax History Compared to Growth
Tax History
| Year | Tax Paid | Tax Assessment Tax Assessment Total Assessment is a certain percentage of the fair market value that is determined by local assessors to be the total taxable value of land and additions on the property. | Land | Improvement |
|---|---|---|---|---|
| 2025 | $5,911 | $424,000 | $150,800 | $273,200 |
| 2024 | $5,690 | $397,600 | $143,700 | $253,900 |
| 2023 | $5,612 | $357,200 | $143,700 | $213,500 |
| 2022 | $5,121 | $303,400 | $123,300 | $180,100 |
| 2021 | $4,931 | $287,000 | $112,100 | $174,900 |
| 2020 | $4,300 | $260,600 | $112,100 | $148,500 |
| 2019 | $4,407 | $264,500 | $108,900 | $155,600 |
| 2018 | $4,290 | $258,600 | $108,100 | $150,500 |
| 2017 | $4,328 | $263,900 | $101,700 | $162,200 |
| 2016 | $3,534 | $211,000 | $81,700 | $129,300 |
| 2015 | $3,435 | $208,200 | $80,800 | $127,400 |
| 2014 | $3,191 | $209,100 | $95,400 | $113,700 |
Source: Public Records
Map
Nearby Homes