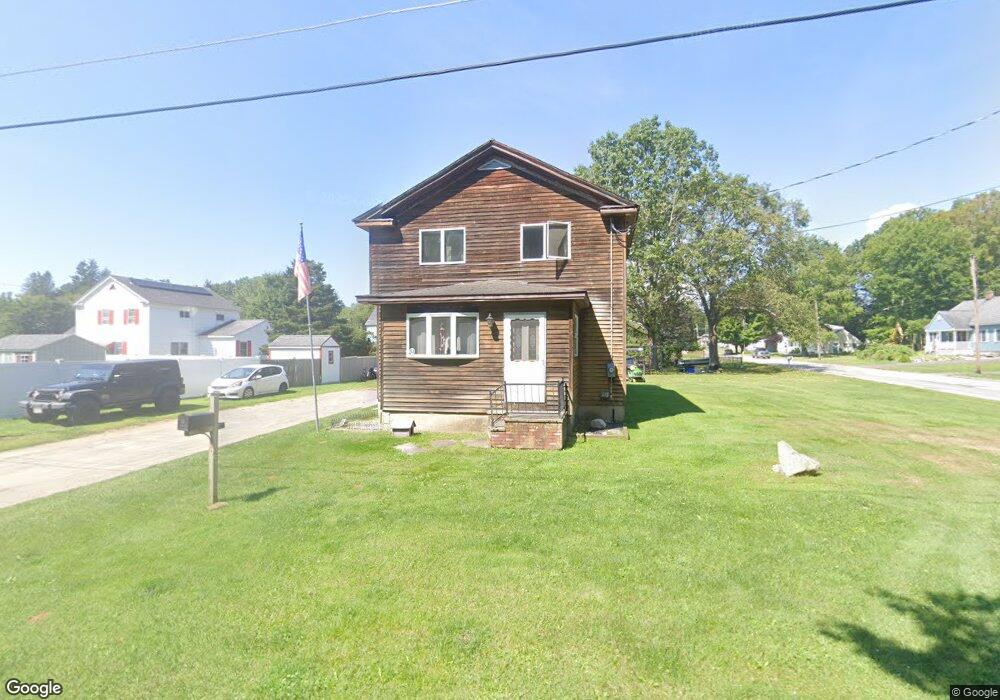
63 Paul Ave Pittsfield, MA 01201
Estimated Value: $266,948 - $297,000
4
Beds
2
Baths
1,680
Sq Ft
$167/Sq Ft
Est. Value
About This Home
This home is located at 63 Paul Ave, Pittsfield, MA 01201 and is currently estimated at $279,737, approximately $166 per square foot. 63 Paul Ave is a home located in Berkshire County with nearby schools including Robert T. Capeless Elementary School, John T. Reid Middle School, and Taconic High School.
Ownership History
Date
Name
Owned For
Owner Type
Purchase Details
Closed on
Oct 18, 2007
Sold by
Flossic Carl E and Flossic Lucille E
Bought by
Hubbard Wendy
Current Estimated Value
Home Financials for this Owner
Home Financials are based on the most recent Mortgage that was taken out on this home.
Original Mortgage
$148,950
Outstanding Balance
$94,445
Interest Rate
6.51%
Mortgage Type
Purchase Money Mortgage
Estimated Equity
$185,292
Purchase Details
Closed on
May 10, 2006
Sold by
Flossic Carl E
Bought by
Lucille Carl E and Lucille Flossic
Create a Home Valuation Report for This Property
The Home Valuation Report is an in-depth analysis detailing your home's value as well as a comparison with similar homes in the area
Home Values in the Area
Average Home Value in this Area
Purchase History
| Date | Buyer | Sale Price | Title Company |
|---|---|---|---|
| Hubbard Wendy | $148,950 | -- | |
| Hubbard Wendy | $148,950 | -- | |
| Hubbard Wendy | $148,950 | -- | |
| Lucille Carl E | -- | -- | |
| Flossic Carl E | -- | -- | |
| Lucille Carl E | -- | -- |
Source: Public Records
Mortgage History
| Date | Status | Borrower | Loan Amount |
|---|---|---|---|
| Open | Hubbard Wendy | $148,950 | |
| Closed | Hubbard Wendy | $148,950 | |
| Previous Owner | Lucille Carl E | $30,000 |
Source: Public Records
Tax History Compared to Growth
Tax History
| Year | Tax Paid | Tax Assessment Tax Assessment Total Assessment is a certain percentage of the fair market value that is determined by local assessors to be the total taxable value of land and additions on the property. | Land | Improvement |
|---|---|---|---|---|
| 2025 | $3,735 | $208,200 | $92,700 | $115,500 |
| 2024 | $3,779 | $204,800 | $92,700 | $112,100 |
| 2023 | $3,574 | $195,100 | $92,700 | $102,400 |
| 2022 | $3,369 | $181,500 | $92,700 | $88,800 |
| 2021 | $3,086 | $160,300 | $92,700 | $67,600 |
| 2020 | $2,614 | $132,600 | $67,700 | $64,900 |
| 2019 | $2,480 | $127,700 | $57,700 | $70,000 |
| 2018 | $2,503 | $125,100 | $57,700 | $67,400 |
| 2017 | $2,460 | $125,300 | $55,200 | $70,100 |
| 2016 | $2,266 | $120,800 | $55,200 | $65,600 |
| 2015 | $2,182 | $120,800 | $55,200 | $65,600 |
Source: Public Records
Map
Nearby Homes