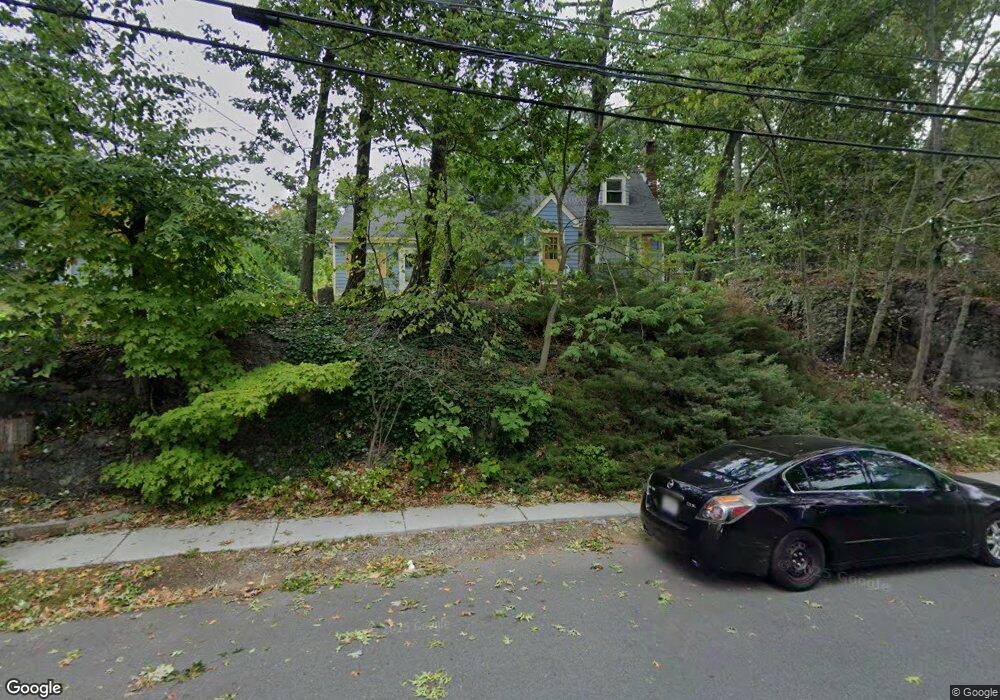
63 Payson Rd Chestnut Hill, MA 02467
South Brookline NeighborhoodEstimated Value: $1,244,000 - $1,492,000
4
Beds
3
Baths
1,932
Sq Ft
$718/Sq Ft
Est. Value
About This Home
This home is located at 63 Payson Rd, Chestnut Hill, MA 02467 and is currently estimated at $1,387,198, approximately $718 per square foot. 63 Payson Rd is a home located in Norfolk County with nearby schools including Baker School, Brookline High School, and Holy Name Parish School.
Ownership History
Date
Name
Owned For
Owner Type
Purchase Details
Closed on
Oct 2, 2001
Sold by
Burlin Betty
Bought by
Merewood Anne and Merewood Makrigiorgos G
Current Estimated Value
Purchase Details
Closed on
Jun 24, 1996
Sold by
Taichman Darren and Taichman Lilach
Bought by
Burlin Betty
Purchase Details
Closed on
Jun 1, 1993
Sold by
Kanegson Louis
Bought by
Taichman Darren and Taichman Lilach
Create a Home Valuation Report for This Property
The Home Valuation Report is an in-depth analysis detailing your home's value as well as a comparison with similar homes in the area
Home Values in the Area
Average Home Value in this Area
Purchase History
| Date | Buyer | Sale Price | Title Company |
|---|---|---|---|
| Merewood Anne | $520,000 | -- | |
| Burlin Betty | $280,000 | -- | |
| Burlin Betty | $280,000 | -- | |
| Taichman Darren | $258,000 | -- | |
| Taichman Darren | $258,000 | -- |
Source: Public Records
Mortgage History
| Date | Status | Borrower | Loan Amount |
|---|---|---|---|
| Closed | Taichman Darren | $295,000 | |
| Closed | Taichman Darren | $300,000 |
Source: Public Records
Tax History
| Year | Tax Paid | Tax Assessment Tax Assessment Total Assessment is a certain percentage of the fair market value that is determined by local assessors to be the total taxable value of land and additions on the property. | Land | Improvement |
|---|---|---|---|---|
| 2025 | $13,259 | $1,343,400 | $885,100 | $458,300 |
| 2024 | $12,613 | $1,291,000 | $851,000 | $440,000 |
| 2023 | $13,343 | $1,338,300 | $877,000 | $461,300 |
| 2022 | $12,987 | $1,274,500 | $835,200 | $439,300 |
| 2021 | $12,010 | $1,225,500 | $803,100 | $422,400 |
| 2020 | $10,829 | $1,145,900 | $730,100 | $415,800 |
| 2019 | $10,225 | $1,091,300 | $695,300 | $396,000 |
| 2018 | $10,152 | $1,073,100 | $691,300 | $381,800 |
| 2017 | $10,002 | $1,012,300 | $652,100 | $360,200 |
| 2016 | $9,858 | $946,100 | $609,500 | $336,600 |
| 2015 | $9,443 | $884,200 | $569,600 | $314,600 |
| 2014 | $9,243 | $811,500 | $516,100 | $295,400 |
Source: Public Records
Map
Nearby Homes
- 67 Risley Rd
- 206 Allandale Rd Unit 3C
- 214 Allandale Rd Unit B
- 91 Grove St
- 10 Hallwood Rd
- 227 Bonad Rd
- 17 Fairgreen Place
- 37 Morey Rd
- 170 Bonad Rd
- 55 Bellingham Rd
- 36 Goodnough Rd
- 87 Buchanan Rd
- 55 Fairgreen Place
- 16 Alberta Rd
- 72 Wallis Rd
- 1401 Centre St Unit 1401
- 60 Alberta Rd
- 33 Meadowbrook Rd
- 12 Allandale St
- 104 Greaton Rd
Your Personal Tour Guide
Ask me questions while you tour the home.