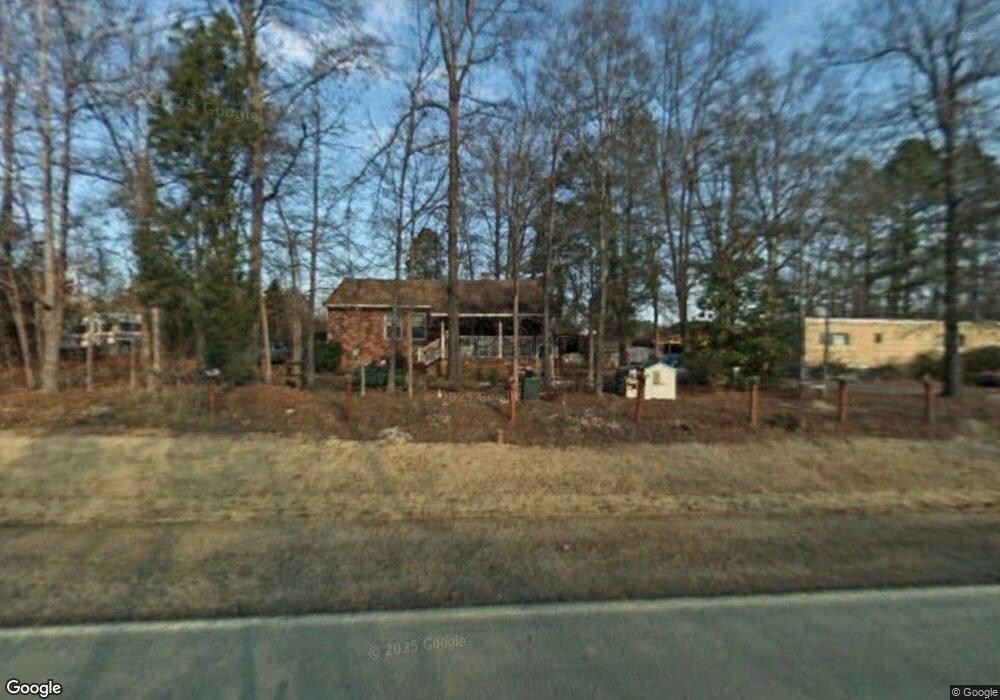
63 Pete Roberson Rd Pittsboro, NC 27312
Estimated Value: $255,000 - $462,000
2
Beds
1
Bath
864
Sq Ft
$379/Sq Ft
Est. Value
About This Home
This home is located at 63 Pete Roberson Rd, Pittsboro, NC 27312 and is currently estimated at $327,330, approximately $378 per square foot. 63 Pete Roberson Rd is a home located in Chatham County with nearby schools including Pittsboro Elementary School, George Moses Horton Middle School, and Northwood High.
Ownership History
Date
Name
Owned For
Owner Type
Purchase Details
Closed on
Apr 15, 2016
Sold by
Snipes Claude W and Snipes Bonika
Bought by
Rogers Jermaine Colden
Current Estimated Value
Purchase Details
Closed on
Dec 31, 1996
Bought by
Rogers Myrtle B
Create a Home Valuation Report for This Property
The Home Valuation Report is an in-depth analysis detailing your home's value as well as a comparison with similar homes in the area
Home Values in the Area
Average Home Value in this Area
Purchase History
| Date | Buyer | Sale Price | Title Company |
|---|---|---|---|
| Rogers Jermaine Colden | $20,000 | Attorney | |
| Rogers Myrtle B | -- | -- |
Source: Public Records
Tax History Compared to Growth
Tax History
| Year | Tax Paid | Tax Assessment Tax Assessment Total Assessment is a certain percentage of the fair market value that is determined by local assessors to be the total taxable value of land and additions on the property. | Land | Improvement |
|---|---|---|---|---|
| 2025 | $1,822 | $234,561 | $91,000 | $143,561 |
| 2024 | $1,822 | $174,655 | $72,000 | $102,655 |
| 2023 | $1,652 | $174,655 | $72,000 | $102,655 |
| 2022 | $1,507 | $174,655 | $72,000 | $102,655 |
| 2021 | $1,507 | $174,655 | $72,000 | $102,655 |
| 2020 | $1,168 | $131,632 | $63,360 | $68,272 |
| 2019 | $1,168 | $131,632 | $63,360 | $68,272 |
| 2018 | $1,075 | $131,632 | $63,360 | $68,272 |
| 2017 | $1,075 | $126,615 | $63,360 | $63,255 |
| 2016 | $730 | $79,980 | $29,250 | $50,730 |
| 2015 | $438 | $79,980 | $29,250 | $50,730 |
| 2014 | -- | $79,980 | $29,250 | $50,730 |
| 2013 | -- | $79,980 | $29,250 | $50,730 |
Source: Public Records
Map
Nearby Homes
- 2b Lucy Mae Page Rd
- 194 Jack Alston Rd
- 652 Richardson Rd
- 75 Clarence Brooks Rd
- 1191 Old Sanford Rd
- 190 Louise Jenkins Rd
- 501 U S 15
- 88 Daisy Scurlock Rd
- 126 Roberson Creek Rd
- 000 Alston Chapel Rd
- 0 Nc 87 Hwy Unit 2491586
- 1838 Alex Cockman Rd
- 323 Wagon Trace
- 1545 Alex Cockman Rd
- 65 Oak Spring Dr
- 0 Dewitt Smith Rd Unit 10069047
- 15 Juniper Ct
- 0 N Carolina 902
- 00 N Carolina 902
- 344 May Farm Rd
- 495 Pittsboro Goldston Rd
- 689 Pittsboro Goldston Rd
- 621 Pittsboro Goldston Rd
- 614 Pittsboro Goldston Rd
- 588 Pittsboro Goldston Rd
- 147 Pete Roberson Rd
- 475 Pittsboro Goldston Rd
- 548 Pittsboro Goldston Rd
- 732 Pittsboro Goldston Rd
- 795 Pittsboro Goldston Rd
- 528 Pittsboro Goldston Rd
- 90 Lucy Mae Page Rd
- 502 Pittsboro Goldston Rd
- 514 Pittsboro Goldston Rd
- 459 Pittsboro Goldston Rd
- 836 Pittsboro Goldston Rd
- 482 Pittsboro Goldston Rd
- 482 Pittsboro Goldston Rd
- 492 Pittsboro Goldston Rd
- 464 Pittsboro Goldston Rd